# Colab: install pymrm if it is not already present.
try:
    import pymrm  # noqa: F401
except ImportError:  # pragma: no cover - only on a fresh Colab VM
%pip install -q pymrmLuedeking-Piret: refitting alpha and beta from the one run whose raw data are printed
sec:J
struct:S1
tier:T0
data:tier2
phase:liquid
Luedeking & Piret (1959) print dP/dt = alpha dN/dt + beta N in their Summary and give six (alpha, beta) pairs, one per pH level, in Table III. THE PAPER USES GREEK alpha AND beta; the catalogue calls them a and b, and this page keeps the paper’s symbols. Only ONE of those six pH levels has its raw data printed - Tables I and II tabulate the pH 6.0 run and nothing else - so this page refits that one row and scopes the other five out rather than digitising Figs. 4-11. THE REFIT IS A CONSISTENCY CHECK ON THE AUTHORS’ OWN GRAPHICAL FIT, NOT A VALIDATION OF THE MODEL, because Table II’s last two columns ARE the axes of the Fig. 11 plot they fitted on: same measurements, both sides. Least squares on those 22 points gives alpha = 2.266562 and beta = 0.528684 against their printed 2.2 and 0.55 - +3.03 % and -3.88 %, and BOTH INSIDE ONE STANDARD ERROR (0.51 and 0.43 se). The two constants are correlated at -0.89, so the pair sits along the fit ridge: holding alpha at their 2.2 returns beta = 0.551282, 0.23 % from their 0.55, and their pair costs only 0.652 % in RMS against the least-squares optimum. Their eyeballed line is statistically indistinguishable from least squares. THE FORM IS TESTED AGAINST TWO NULLS, both of them models the paper itself considers and rejects: over all 22 rows dP/dt proportional to growth rate alone is 5.55x worse in RMS and dP/dt proportional to bacterial density alone 4.92x worse. THE DIRECTION OF THOSE RATIOS IS ALGEBRA, since each null is a nested submodel, SO BOTH HALVES OF THE PAPER’S SENTENCE ARE MEASURED: on the logarithmic plateau, where the paper says both one-term forms ARE valid, they cost only 1.036x and 1.033x, and outside it 5.01x and 3.71x. A THIRD ROUTE TO THE CONSTANTS USES NO DIFFERENTIATED COLUMN AT ALL - integrating eq. (2) and fitting the P column directly gives alpha = 2.272660, beta = 0.510150 - and the integrated model with the AUTHORS’ printed constants predicts the whole measured acid curve to 1.70 % rms and the final 43.3 mg/ml to +3.12 %. TABLE II CHECKS ITSELF and the page measures how well: k = (1/N)(dN/dt) holds to 2.74 % across 25 rows, and 87.37 % of all single-digit substitutions in the (N, dN/dt, k) triple break it by more than that. TWO PRINTED FEATURES ARE REPORTED AND NOT REPAIRED: the pH 5.6 beta cell of Table III carries a stray mid-dot-sized mark before its leading zero, and the reading 0.49 is settled THREE WAYS, arithmetic first - the notebook’s own assertion that beta falls monotonically as pH falls FAILS under the minus reading, and its break row prices the violation at 2800 % on beta_monotone_margin; the paper’s own Fig. 10 (book p. 407) plots beta against pH on a ZERO-BASED axis with all six points above the axis, that one at about +0.50; and only then a connected-component measurement on a 7x crop, which makes the mark a mid-dot (4x3 px, area 8) and not the page’s own hyphen (11x4 px, area 38). The pixels corroborate an arithmetic conclusion rather than carrying it alone, and no value read off Fig. 10 enters any dataset or metric. The other feature is that the paper’s Nomenclature lists alpha and beta as ‘Constants’ with no units, which appear only in Table III’s footnotes. The pymrm content is a batch fermenter marched with newton + NumJac and a plug-flow fermenter built from construct_convflux_upwind + construct_div, both checked against a closed form the model has exactly - P = P_0 + alpha (N - N_0) + beta int N dt - and both first order as expected.
Luedeking-Piret: refitting \(\alpha\) and \(\beta\) from the one run whose raw data are printed
Catalog ID: J4.4 · Structures: S1 · Tier: T0
Background
The source is on disk and all twenty pages were read at the file’s native resolution:
Luedeking, R. and Piret, E. L., A Kinetic Study of the Lactic Acid Fermentation. Batch Process at Controlled pH, Journal of Biochemical and Microbiological Technology and Engineering 1(4), 393-412 (1959), doi:
10.1002/jbmte.390010406.
Identity confirmed from the document’s own first page, on a 300 ppi render: the masthead “Journal of Biochemical and Microbiological Technology and Engineering / VOL. I, NO. 4. PAGES 393-412 (1959)”, the title, the by-line “ROBERT LUEDEKING and EDGAR L. PIRET / Department of Chemical Engineering, University of Minnesota / Minneapolis 14, Minnesota”, and the Summary, which prints the relation this case is about. pdfimages -list reports every text page as CCITT-G4 bilevel at 300x300 ppi, so 300 ppi is native and rendering higher would be interpolation. Three byte-identical copies of the file arrived (md5 601827724b39cac54e549e8aebb1227e, 885270 bytes each); two are parked in ~/papers/pymrm-gallery/duplicates/ and are not parts.
Two things about the source that decide how this page is built
Every decimal point in this paper is a British mid-dot. 2.2 prints as a 2 followed by a raised dot, and the Summary’s pH range prints as “between 4·5 and 6·0”. The text layer of this scan relocates and drops them: it renders book p. 406’s pH 5.4 as pH 3.4 and, one line later, as pH 3 4; it renders the U.O.D. definition N = 0.125r as N = 0.12%. No number on this page came off the text layer. The text layer was used to find things - that is what the negative-claim searches below run on - and every numeral was then read on a crop of the 300 ppi bilevel image enlarged to digit scale. (Book page = PDF page + 392 throughout, confirmed on the printed running heads: PDF 8 reads 400, PDF 14 reads 406 ROBERT LUEDEKING AND EDGAR L. PIRET, PDF 15 reads 407, PDF 17 reads 409. Those were read on crops too, because the digit is exactly what this text layer is not to be trusted with.)
The paper’s symbols are \(\alpha\) and \(\beta\). The catalogue entry for this case, and this repository’s own case yaml, both write the relation with a and b. The Summary, eq. (2), eq. (3), Table III, Fig. 10 and the Nomenclature all print Greek \(\alpha\) and \(\beta\). This page uses the paper’s symbols throughout and records the discrepancy here rather than renaming anything silently.
What the paper prints, and what it does not
Three tables, and only one fermentation is tabulated.
| where | what | |
|---|---|---|
| Table I | book p. 401 (PDF 9) | “Bacterial density during batch fermentation” - 45 (time, \(N\)) pairs |
| Table II | book p. 402 (PDF 10) | “Growth and lactic acid synthesis during batch fermentation” - 27 rows of \(N\), \(P\), \(dN/dt\), \(dP/dt\), \(k\), \((1/N)(dP/dt)\) |
| Table III | book p. 410 (PDF 18) | “Experimental constants \(\alpha\) and \(\beta\) of equations 3 and 2 for each pH level” - six (pH, \(\alpha\), \(\beta\)) triples |
Tables I and II both carry the footnote “At 45°C, pH controlled at 6·0, on a 5 per cent glucose medium fortified with 3 per cent yeast extract and added mineral salts, L. delbrueckii”, and the running text on book p. 401 says so directly: “As an example, the rate information for the fermentation at pH 6·0 is tabulated in Tables I and II”.
So five of Table III’s six rows have no printed raw data anywhere in this paper, and that half of the case is out of scope. The claim is checkable and here is the check, stated so that it reproduces exactly. pdftotext -layout over all twenty pages, then
grep -c "Table" all.txt -> 5 grep -ci "table" all.txt -> 6The five case-sensitive hits are every mention of a table in the paper: the three captions (the text layer renders the last two as Table 11 and Table 111), the running-text sentence on book p. 401 this page quotes twice - “the rate information for the fermentation at pH 6·0 is tabulated in Tables I and 11” - and the cross-reference on book p. 409, “can be seen from Table I11 and from Fig. 10”. The sixth case-insensitive hit is not a table at all: it is the word “unsuitable” in running text on book p. 398. All twenty rendered pages were then looked at for ruled blocks; the only three are on PDF pages 9, 10 and 18. The other five fermentations appear as plotted curves in Figs. 4-11 and as fitted constants in Table III. No curve on any figure is digitised on this page. What that costs is stated in Validation.
What this page therefore does
The paper’s Summary states the relation and says the constants depend on pH:
“It was found that the instantaneous rate of acid formation d\(P\)/d\(t\), could be related to the instantaneous rate of bacterial growth d\(N\)/d\(t\), and to the bacterial density \(N\), throughout a fermentation at a given pH, by the expression \(\mathrm{d}P/\mathrm{d}t = \alpha\,\mathrm{d}N/\mathrm{d}t + \beta N\) where the constants \(\alpha\) and \(\beta\) are determined by the pH of the fermentation.”
- Refit \(\alpha\) and \(\beta\) from Tables I and II and compare against Table III’s printed pH 6.0 pair. Three routes, one of which touches no differentiated column at all.
- Test the two-term form against the two one-term nulls - and both nulls are models this paper itself puts up and knocks down, so the comparison is the paper’s own argument made quantitative.
- Report the pH trends of the six printed pairs without refitting five of them, and say plainly what six numbers can and cannot establish.
- Put the relation into pymrm as a source term in a batch and in a plug-flow fermenter, checked against a closed form the model happens to have exactly.
The one thing this page must not be read as claiming
The refit is a consistency check on the authors’ own fit, not a validation of their model. Book p. 409: “The constants \(\alpha\) and \(\beta\) are determined from the plots of Fig. 11”, and Fig. 11 plots \((1/N)(\mathrm{d}P/\mathrm{d}t)\) against \(k\) - which are Table II’s last two columns. The data on both sides of the comparison are the same measurements. Recovering 2.2 and 0.55 from them says the authors’ straight-edge and least squares agree; it says nothing about whether the relation would hold on a fermentation they did not run. That sentence is repeated in Validation and in meta.yaml, and every number below is labelled fit or test accordingly.
The published model
Book p. 408, in the paper’s own words - “A reasonably close correlation can be obtained if it be assumed that the rate of acid synthesis is related both to the rate of growth and to the quantity of bacteria present, using the simplest possible relationship”:
\[\frac{\mathrm{d}P}{\mathrm{d}t} = \alpha\,\frac{\mathrm{d}N}{\mathrm{d}t} + \beta N \tag{2}\]
“where \(\alpha\) and \(\beta\) are constants of proportionality”. And then, same page - “It is easier to verify this assumed relationship and to evaluate the constants if the equation be modified by dividing by \(N\)”, and “since, by definition, \(k = (1/N)(\mathrm{d}N/\mathrm{d}t)\), the equation finally simplifies to”:
\[\frac{1}{N}\frac{\mathrm{d}P}{\mathrm{d}t} = \alpha k + \beta \tag{3}\]
Eq. (3) is eq. (2) divided by \(N\) and nothing else. They are the same model. They are not the same fit: least squares on eq. (3) weights each row equally, least squares on eq. (2) weights it by \(N^2\), and \(N\) spans a factor of 78 down this table. The page reports both and says which is which.
Two of Table II’s columns are the two axes of eq. (3). That is why the refit is possible at all, and it is also exactly why the refit is a consistency check: book p. 409, “When the experimental values of \((1/N)(\mathrm{d}P/ \mathrm{d}t)\) are plotted against \(k\) in Fig. 11, the points fall close to a straight line, thus tending to confirm the validity of equations 3 and 2”, and p. 410, “The constants \(\alpha\) and \(\beta\) are determined from the plots of Fig. 11.”
The two nulls, and that they are the paper’s own
Eq. (2) has two one-term degenerate cases, and the paper puts both of them up by name before rejecting them. Book p. 410:
“during the phase of logarithmic growth the two common assumptions mentioned above for relating rate of acid production to growth are both valid. This is true because \((\mathrm{d}N/\mathrm{d}t) = kN\), and during the logarithmic phase \(k\) is a constant, \(k_c\). Thus one can state with equal validity that during the logarithmic phase the rate of acid production is proportional to the growth rate of the bacteria, or that during this phase the rate of acid production is proportional to the quantity of bacteria present. Neither statement was found to hold true outside of the period of logarithmic growth, while equation 3, of course, was found to apply throughout the entire fermentation cycle.”
So the null baselines this page computes beside the headline are \(\beta = 0\) (“proportional to the growth rate”) and \(\alpha = 0\) (“proportional to the quantity of bacteria present”), and they are not straw men chosen here - they are the two alternatives the authors themselves name.
What the constants mean, and the crossover the paper describes in words
Book p. 410: “The rate of acid production per cell for the first process is represented by \(\alpha k\) and is therefore proportional to the specific growth rate. For the second process the rate of acid production per cell is a constant at a given pH level. In the early phases of a normal fermentation when the specific growth rate is high, the first term of equation 3 is the important one, while towards the end of the fermentation the second term becomes more important. For ‘resting’ cells where there is supposedly no growth occurring, the first term should be zero and all acid is produced in accordance with the second term of the equation, the constant \(\beta\).”
That prose contains a number the paper never writes down. The two terms of eq. (3) are equal at
\[k^{*} = \beta/\alpha,\]
which has units of \(\mathrm{h}^{-1}\) and is the specific growth rate at which the fermentation stops being growth-dominated. It is computed below for all six pH levels, and the time at which the pH 6.0 run crosses it is root-found on Table II - by two routes that share no column.
Units, and where they are printed
Table III’s footnotes are the only place in the paper that gives \(\alpha\) and \(\beta\) units: “\(\alpha\) has the units mg lactic/U.O.D.” and “\(\beta\) has the units mg lactic/U.O.D./h”. The Nomenclature on book p. 411 lists “\(\alpha\), \(\beta\) Constants” with no units at all. Reported, not repaired.
\(N\) is not a cell count. Book p. 400 defines it: a sample diluted \(r\)-fold to 75 % transmission has \(N = 0{\cdot}125r\) U.O.D./ml, and “for the L. delbrueckii used in this study, one unit of optical density corresponded to between 150,000,000 and 450,000,000 cells as determined by plate counts” - a factor of three of slack, so U.O.D. is an optical surrogate for biomass and the constants inherit that.
import json
import sys
from pathlib import Path

import matplotlib.pyplot as plt
import numpy as np
import pandas as pd
from scipy.interpolate import PchipInterpolator
from scipy.optimize import brentq

from pymrm import (NumJac, compute_boundary_values, construct_convflux_upwind,
                   construct_div, newton)

# gallery_utils: from the checkout when there is one, from raw GitHub on Colab
if "google.colab" in sys.modules:
    import urllib.request
    urllib.request.urlretrieve(
        "https://raw.githubusercontent.com/computational-chemical-engineering/"
        "pymrm-gallery/main/shared/gallery_utils.py", "gallery_utils.py")
else:
    for _p in (Path.cwd(), *Path.cwd().parents):
        if (_p / "shared" / "gallery_utils.py").is_file():
            sys.path.insert(0, str(_p / "shared"))
            break
from gallery_utils import cite_data, load_data, load_meta, report_agreement

PAGE = "J4.4-luedeking-piret"
plt.rcParams.update({"figure.dpi": 110, "font.size": 9.5})
# Okabe-Ito, assigned in fixed order and never cycled
C_BLUE, C_ORANGE, C_GREEN = "#0072B2", "#D55E00", "#009E73"
C_PURPLE, C_YELLOW, C_GREY = "#CC79A7", "#E69F00", "0.45"

# DETERMINISM: nothing on this page is stochastic.  No sampling, no bootstrap,
# no random initial guess, no continuation chain.  Two consecutive executions
# give identical content, figures and agreement.json.
np.set_printoptions(precision=8, suppress=False)

# ------------------------------------------------------------ the three tables
T1 = load_data("luedeking1959-table1-bacterial-density.csv", page=PAGE)
T2 = load_data("luedeking1959-table2-growth-acid.csv", page=PAGE)
T3 = load_data("luedeking1959-table3-alpha-beta-vs-ph.csv", page=PAGE)
M1 = load_meta("luedeking1959-table1-bacterial-density.csv", page=PAGE)
M2 = load_meta("luedeking1959-table2-growth-acid.csv", page=PAGE)
M3 = load_meta("luedeking1959-table3-alpha-beta-vs-ph.csv", page=PAGE)
for m in (M1, M2, M3):
    print(cite_data(m))
print(f"\nTable I  : {len(T1)} rows, {T1.time_h.min():.2f}-{T1.time_h.max():.2f} h")
print(f"Table II : {len(T2)} rows, {T2.time_h.min():.2f}-{T2.time_h.max():.2f} h,"
      f" {T2.notna().sum().sum()} filled cells of {T2.size}")
print(f"Table III: {len(T3)} rows, pH {T3.pH.min():.1f}-{T3.pH.max():.1f}")

# THE PRINTED pH 6.0 PAIR - looked up in the CSV, never retyped in a cell.
_r60 = T3.loc[T3.pH == 6.0].iloc[0]
ALPHA_PRINTED = float(_r60.alpha_mg_lactic_per_UOD)
BETA_PRINTED = float(_r60.beta_mg_lactic_per_UOD_h)
print(f"\nTable III, pH 6.0:  alpha = {ALPHA_PRINTED}  mg lactic/U.O.D."
      f"     beta = {BETA_PRINTED}  mg lactic/U.O.D./h")
Luedeking, R.; Piret, E. L. (1959) — "A Kinetic Study of the Lactic Acid Fermentation. Batch Process at Controlled pH", Journal of Biochemical and Microbiological Technology and Engineering 1(4) 393-412 (1959), Department of Chemical Engineering, University of Minnesota, Minneapolis 14, Minnesota
— doi:10.1002/jbmte.390010406 — transcription
Luedeking, R.; Piret, E. L. (1959) — "A Kinetic Study of the Lactic Acid Fermentation. Batch Process at Controlled pH", Journal of Biochemical and Microbiological Technology and Engineering 1(4) 393-412 (1959), Department of Chemical Engineering, University of Minnesota, Minneapolis 14, Minnesota
— doi:10.1002/jbmte.390010406 — transcription
Luedeking, R.; Piret, E. L. (1959) — "A Kinetic Study of the Lactic Acid Fermentation. Batch Process at Controlled pH", Journal of Biochemical and Microbiological Technology and Engineering 1(4) 393-412 (1959), Department of Chemical Engineering, University of Minnesota, Minneapolis 14, Minnesota
— doi:10.1002/jbmte.390010406 — transcription
Table I : 45 rows, 0.10-13.60 h
Table II : 27 rows, 1.00-14.00 h, 171 filled cells of 189
Table III: 6 rows, pH 4.5-6.0
Table III, pH 6.0: alpha = 2.2 mg lactic/U.O.D. beta = 0.55 mg lactic/U.O.D./hParameters and assumptions
Nothing on this page is a chosen parameter. There is no rate constant to pick, no initial guess that matters, and no tuning: the inputs are three printed tables and the outputs are least-squares fits to them plus two solver discretisations. What is an assumption is listed here.
| value | where it comes from | |
|---|---|---|
| temperature | 45 °C | Tables I and II footnotes, book pp. 401-402 |
| pH | 6·0, controlled | same footnotes; the only tabulated run |
| medium | 5 % glucose + 3 % yeast extract + mineral salts | same footnotes |
| organism | L. delbrueckii NRRL-B445 | book p. 401 |
| \(N\) unit | U.O.D./ml, \(N = 0{\cdot}125\,r\) | book p. 400 |
| \(\alpha\), \(\beta\) units | mg lactic/U.O.D., mg lactic/U.O.D./h | Table III footnotes ONLY |
Assumption 1 - the fits are unweighted least squares. The authors fitted by drawing a straight line through Fig. 11, which is an unstated weighting. This page uses ordinary least squares in eq. (3)’s variables as the primary route because those are the variables they plotted, and reports the eq. (2) fit (which is the same problem weighted by \(N^2\)) beside it rather than choosing between them. The spread between the routes is a reported number, not a footnote.
Assumption 2 - \(k(t)\) and \(N(t)\) between the printed rows are monotone cubic (PCHIP) interpolants of the printed columns. They are used only where an interpolant is unavoidable: the \(\int N\,\mathrm{d}t\) of the integral form, the root-find for the crossover time, and the prescribed \(k(z)\) of the plug-flow model. A linear interpolant is carried as a break row so the choice is priced rather than assumed.
Assumption 3 - the one-significant-figure row at \(t = 2{\cdot}50\) h is used at face value. Table II prints 0.8, 0.4 and 1.8 there, against two and three figures everywhere else. It is kept, and a break row drops it.
What is NOT assumed: a growth law. Luedeking & Piret do not propose one, and this page does not import one. Where a closed system is needed - the pymrm batch and plug-flow models - \(k\) is prescribed from the paper’s own printed \(k\) column. That keeps the product-formation model, which is what this case is about, separated from a growth model, which is J4.1’s and J4.2’s.
# ------------------------------------------- Table II checks itself, measured
# Book p. 400: "Instantaneous rates of growth and of acid formation were
# determined by graphical differentiation of curves ... The specific rate of
# growth and the specific rate of acid formation were determined by dividing the
# instantaneous rates by N."  So k and (1/N)(dP/dt) are QUOTIENTS of the other
# printed columns BY DEFINITION, and that is an arithmetic check on the
# transcription - the only one any of the three tables offers.
_k = T2.dropna(subset=["k_per_h", "N_UOD_per_ml", "dNdt_UOD_per_ml_h"])
K_IDENT = np.abs(_k.dNdt_UOD_per_ml_h/_k.N_UOD_per_ml/_k.k_per_h - 1.0).to_numpy()
K_IDENT_MAX, K_IDENT_MEAN = float(K_IDENT.max()), float(K_IDENT.mean())
K_IDENT_AT = float(_k.time_h.to_numpy()[K_IDENT.argmax()])
_q = T2.dropna(subset=["invN_dPdt_mg_per_UOD_h", "N_UOD_per_ml", "dPdt_mg_per_ml_h"])
Q_IDENT = np.abs(_q.dPdt_mg_per_ml_h/_q.N_UOD_per_ml/_q.invN_dPdt_mg_per_UOD_h
                 - 1.0).to_numpy()
Q_IDENT_MAX = float(Q_IDENT.max())
Q_IDENT_AT = float(_q.time_h.to_numpy()[Q_IDENT.argmax()])
N_SPAN = float(T2.N_UOD_per_ml.max()/T2.N_UOD_per_ml.min())
print(f"printed N spans a factor of {N_SPAN:.4f} down this table, which is why"
      f" eq. (2) and\neq. (3) are two different least-squares problems and both"
      f" are reported.\n")
print(f"k = (1/N)(dN/dt) over {len(_k)} rows: max {K_IDENT_MAX:.6f}"
      f" at t = {K_IDENT_AT:.2f} h, mean {K_IDENT_MEAN:.6f}")
print(f"(1/N)(dP/dt) over {len(_q)} rows:     max {Q_IDENT_MAX:.6f}"
      f" at t = {Q_IDENT_AT:.2f} h")
print("  -> the columns are rounded independently AFTER the division, so they are"
      "\n     self-consistent only to a few per cent.  That band is the resolution"
      "\n     of the arithmetic check, and it is measured next rather than assumed.")


def digit_detection(tol):
    """How many single-digit substitutions the k identity would catch."""
    cols = ["N_UOD_per_ml", "dNdt_UOD_per_ml_h", "k_per_h"]
    total = caught = 0
    for _, r in _k.iterrows():
        for c in cols:
            s = f"{r[c]:g}"
            for j, ch in enumerate(s):
                if not ch.isdigit():
                    continue
                for d in "0123456789":
                    if d == ch:
                        continue
                    v = float(s[:j] + d + s[j + 1:])
                    if v <= 0:
                        continue
                    trip = {"N_UOD_per_ml": r.N_UOD_per_ml,
                            "dNdt_UOD_per_ml_h": r.dNdt_UOD_per_ml_h,
                            "k_per_h": r.k_per_h}
                    trip[c] = v
                    total += 1
                    if abs(trip["dNdt_UOD_per_ml_h"]/trip["N_UOD_per_ml"]
                           / trip["k_per_h"] - 1.0) > tol:
                        caught += 1
    return caught, total


DIGIT_CAUGHT, DIGIT_TOTAL = digit_detection(K_IDENT_MAX)
DIGIT_FRAC = DIGIT_CAUGHT/DIGIT_TOTAL
print(f"\nTRANSCRIPTION CHECK, TEETH MEASURED NOT CLAIMED: of the {DIGIT_TOTAL}"
      f" single-digit\nsubstitutions available in the (N, dN/dt, k) triple,"
      f" {DIGIT_CAUGHT} ({DIGIT_FRAC:.2%}) break the identity by"
      f"\nmore than the {K_IDENT_MAX:.4f} the true table already shows."
      f"  The {DIGIT_TOTAL - DIGIT_CAUGHT} it cannot see are\nalmost all"
      f" last-digit +-1 and +-2 changes, which the round-off band swallows.")

# ------------------------------------- Table I against Table II's "Interpolated"
NT1 = PchipInterpolator(T1.time_h.to_numpy(), T1.N_UOD_per_ml.to_numpy())
_n2 = T2.dropna(subset=["N_UOD_per_ml"])
_n2 = _n2[(_n2.time_h >= T1.time_h.min()) & (_n2.time_h <= T1.time_h.max())]
_rel = np.abs(NT1(_n2.time_h.to_numpy())/_n2.N_UOD_per_ml.to_numpy() - 1.0)
X_TABLE_MAX, X_TABLE_RMS = float(_rel.max()), float(np.sqrt((_rel**2).mean()))
X_TABLE_AT = float(_n2.time_h.to_numpy()[_rel.argmax()])
_lin = np.interp(_n2.time_h.to_numpy(), T1.time_h.to_numpy(),
                 T1.N_UOD_per_ml.to_numpy())
_rl = np.abs(_lin/_n2.N_UOD_per_ml.to_numpy() - 1.0)
X_TABLE_LIN_MAX = float(_rl.max())
print(f"\nTable II's N is footnoted \"* Interpolated\".  Interpolating Table I onto"
      f" its\n{len(_n2)} overlapping times reproduces it to {X_TABLE_RMS:.6f} rms and"
      f" {X_TABLE_MAX:.6f} at worst\n(t = {X_TABLE_AT:.2f} h); a linear interpolant"
      f" gives {X_TABLE_LIN_MAX:.6f} at the same row.  The residual is\nthe authors'"
      f" own smoothing - Table II's N is read off a drawn curve, not off Table I.")
printed N spans a factor of 78.3333 down this table, which is why eq. (2) and
eq. (3) are two different least-squares problems and both are reported.
k = (1/N)(dN/dt) over 25 rows: max 0.027356 at t = 3.50 h, mean 0.008089
(1/N)(dP/dt) over 22 rows: max 0.018410 at t = 12.00 h
-> the columns are rounded independently AFTER the division, so they are
self-consistent only to a few per cent. That band is the resolution
of the arithmetic check, and it is measured next rather than assumed.
TRANSCRIPTION CHECK, TEETH MEASURED NOT CLAIMED: of the 2019 single-digit
substitutions available in the (N, dN/dt, k) triple, 1764 (87.37%) break the identity by
more than the 0.0274 the true table already shows. The 255 it cannot see are
almost all last-digit +-1 and +-2 changes, which the round-off band swallows.
Table II's N is footnoted "* Interpolated". Interpolating Table I onto its
26 overlapping times reproduces it to 0.012495 rms and 0.033774 at worst
(t = 5.00 h); a linear interpolant gives 0.033333 at the same row. The residual is
the authors' own smoothing - Table II's N is read off a drawn curve, not off Table I.The data
Three CSVs, one per printed table, each transcribed cell by cell from 300 ppi crops enlarged to digit scale. The sidecars carry the crop procedure, the footnotes verbatim, and the defect notes.
luedeking1959-table1-bacterial-density.csv- 45 rows, book p. 401.luedeking1959-table2-growth-acid.csv- 27 rows, book p. 402. This is the file the constants are refitted from. Blank cells are left blank: the paper prints no \(P\) at 1·00, 1·50 and 3·00 h, no \(k\) at 1·50 h, and only \(P\) at the final 14·00 h row.luedeking1959-table3-alpha-beta-vs-ph.csv- 6 rows, book p. 410.
Table III, cell by cell
Read at 3x on a 300 ppi crop and the \(\beta\) column again at 7x:
| pH | \(\alpha\) (mg lactic/U.O.D.) | \(\beta\) (mg lactic/U.O.D./h) |
|---|---|---|
| 6·0 | 2·2 | 0·55 |
| 5·6 | 2·2 | 0·49 (stray mark - see below) |
| 5·4 | 2·2 | 0·32 |
| 5·2 | 2·45 | 0·26 |
| 4·8 | 3·0 | 0·14 |
| 4·5 | 3·55 | 0·11 |
One of the three columns has a printed cross-check outside the table. Book p. 400, running text: the six fermentations were “each of which was continuously controlled at a different pH level (6·0, 5·6, 5·4, 5·2, 4·8 and 4·5)”. That is Table III’s whole pH column, printed a second time ten pages earlier, and the cell below asserts the CSV against it rather than saying it in prose. The \(\alpha\) and \(\beta\) columns have no such second printing.
The stray mark in the pH 5·6 \(\beta\) cell - reported, not repaired
At 150 ppi that cell renders as -0-49, which is why it was flagged before dispatch. The value is 0·49, and it is settled three ways. The standing rule is that an ambiguous glyph is settled by arithmetic wherever arithmetic exists, and by pixel shape only where it does not; two arithmetic settlements exist here, so they lead and the pixels corroborate.
1. The minus reading breaks a relation this notebook asserts. \(\beta\) falls monotonically as the pH falls, over all six levels, and cell The six pH levels below executes assert BETA_MONOTONE. Read the mark as a sign and the descending-pH sequence becomes 0·55, −0·49, 0·32, … - not monotone, and the notebook refuses to execute. The same cell prints that failure explicitly rather than leaving it to be imagined, and a break row prices the violation: it moves beta_monotone_margin by 2800 %. This is a pattern in six printed numbers rather than a derived identity, and it is labelled as one - but a sign error is exactly the size of error it catches.
2. The paper plots this very column on a zero-based axis. Fig. 10, book p. 407 (PDF 15), plots \(\beta\) against pH with the axis labelled 0, 0·2, 0·4, 0·6 and six open circles all standing clearly above the zero line; the caption prints eq. (3) itself, “The effect of pH on the coefficients \(\alpha\) and \(\beta\) in the equation \((1/N)(\mathrm{d}P/\mathrm{d}t) = \alpha k + \beta\)”. Calibrated on the panel’s own gridlines the pH 5·6 marker sits at \(\beta \approx 0{\cdot}50\), and all six markers land within about 0·02 of the printed column - “about”, because the gridline centres themselves are ambiguous by a pixel or two and the largest deviation moves with them. That reading corroborates a sign; it is not a data source. No number off Fig. 10 enters a CSV, a fit or a metric, this page still digitises no curve, and the figure could not carry the value anyway - only the printed table can, which is why an approximate bound is quoted as a check and not as a measurement. What the reading has to separate is \(+0{\cdot}49\) from \(-0{\cdot}49\), so a tolerance of a few hundredths either way decides nothing.
3. And only then, the pixels. The mark is a single connected component of 8 pixels, 4 wide by 3 high, at (x 1023-1026, y 545-547) of the 300 ppi page, sitting 3 px to the left of a leading zero that is itself complete and undamaged - its two strokes span x 1030-1044, exactly the span of every other zero in that column.
| width | height | area | |
|---|---|---|---|
| the mark | 4 px | 3 px | 8 |
| the five genuine mid-dots in the same \(\beta\) column | 3-4 px | 3-4 px | 8-11 |
the page’s one true hyphen (Rouy-Photrometer, same page) |
11 px | 4 px | 38 |
A connected-component census of the whole page returns zero components of area 4-20 with no other ink within 12 px of them - the scan produces no free-floating specks of this size anywhere on the page. (An earlier, looser census - “round blob with no ink within 14 px to its left” - was quoted on this page as 38 hits with 37 in the Wiley watermark. That count does not reproduce: it swings between 43 and 407 depending on how “round blob” is pinned, so it has been withdrawn in favour of the criterion above, which reproduces exactly.)
What the mark is - broken type, an ink speck on the original, or dirt on the platen - cannot be settled from one copy and is not guessed at here. What is settled is the value: two arithmetic checks and the digits 0·49, intact and unambiguous at 7x. The CSV carries 0·49 and the sidecar carries the mark. A break row prices the alternative reading, so the cost of being wrong is on the page rather than in a footnote.
What Table III can and cannot check about itself
Table III has no internal identity. Six rows, three independent columns, no derived quantity, no total, no ratio printed beside them - so unlike Table II nothing inside this table constrains anything else inside it, and each cell rests on its own crop read. What the table is not short of is arithmetic around it: the pH column is printed again on book p. 400, \(\beta(\mathrm{pH})\) is plotted on a zero-based axis in Fig. 10, the monotonicity of \(\beta\) is asserted by this notebook, and the pH 6·0 row alone can be refitted from Tables I and II. The earlier version of this page said the table “offers no arithmetic at all” and rested the pH 5·6 reading on component geometry; that was wrong about the source, and it is corrected above rather than quietly dropped.
Table II, by contrast, does check itself - \(k\) and \((1/N)(\mathrm{d}P/ \mathrm{d}t)\) are quotients of its other columns by the paper’s own definition (book p. 400) - and the cell above measures how far that goes.
PyMRM implementation
Eq. (2) is a source term, not a transport problem: it says how fast \(P\) appears given \(N\) and \(\mathrm{d}N/\mathrm{d}t\). So the pymrm content is what happens when that source is carried by a reactor model, and there are two, both closed by the paper’s own printed \(k\) column rather than by an imported growth law.
1. Batch fermenter. State \((N, P)\), marched by backward Euler with pymrm’s newton and a NumJac((1, 2)) - a 1-cell shape whose last axis is the field index, which is the stencil that couples the two fields in full and nothing else:
\[\frac{\mathrm{d}N}{\mathrm{d}t} = k(t)\,N, \qquad \frac{\mathrm{d}P}{\mathrm{d}t} = \alpha\,k(t)\,N + \beta N .\]
2. Plug-flow fermenter. The same source in a steady tubular fermenter, assembled with construct_convflux_upwind + construct_div (nu=0, Cartesian), solved with newton + NumJac((n, 2)), outlet read with compute_boundary_values. The boundary conditions use the outward normal, so the two dicts read \(a\,\partial c/\partial n + b\,c = d\) with \(n\) pointing out of the domain: at the inlet that is a Dirichlet feed \(\{a=0, b=1, d=(N_0, P_0)\}\), and at the outlet a pure outflow \(\{a=1, b=0, d=0\}\), i.e. \(\partial c/\partial z = 0\) there.
This is the paper’s own stated motivation, from the Summary: “Kinetic data are needed to develop basic understanding of fermentation processes and to permit rational design of continuous fermentation processes.” It is not something Luedeking & Piret did, and no measurement in this paper tests it - the plug-flow model is checked against a closed form, not against data, and that is said again in Validation.
The closed form. With \(k(t)\) prescribed, both models integrate exactly:
\[N(t) = N_0\exp\!\int_{t_0}^{t}\! k\,\mathrm{d}t', \qquad P(t) = P_0 + \alpha\,[N(t) - N_0] + \beta\!\int_{t_0}^{t}\! N\,\mathrm{d}t' .\]
The second is eq. (2) integrated and it is the reference both solvers are checked against. It is also the third fitting route below - fit \(P\) itself and no differentiated column enters at all.
# ------------------------------------------------- prescribed k(t) and N(t)
_kk = T2.dropna(subset=["k_per_h"])
KT = PchipInterpolator(_kk.time_h.to_numpy(), _kk.k_per_h.to_numpy())
KANTI = KT.antiderivative()
T_LO, T_HI = float(_kk.time_h.min()), float(_kk.time_h.max())
N_LO = float(T2.loc[T2.time_h == T_LO, "N_UOD_per_ml"].iloc[0])
P_LO = 0.0                    # the closed form is affine in P_0; it cancels below

_nn = T2.dropna(subset=["N_UOD_per_ml"])
NT2 = PchipInterpolator(_nn.time_h.to_numpy(), _nn.N_UOD_per_ml.to_numpy())
NT2_INT = NT2.antiderivative()


def N_closed(t):
    """N from integrating the PRINTED k column - no growth law imported."""
    return N_LO*np.exp(KANTI(t) - KANTI(T_LO))


_g = np.linspace(T_LO, T_HI, 160001)
N_CLOSED_INT = PchipInterpolator(_g, N_closed(_g)).antiderivative()


def P_closed(t, a, b):
    """eq. (2) integrated, with N from the printed k column."""
    return P_LO + a*(N_closed(t) - N_LO) + b*(N_CLOSED_INT(t) - N_CLOSED_INT(T_LO))


# ---------------------------------------------------- 1. pymrm batch marcher
def batch_march(nt, a, b, t_lo=None, t_hi=None):
    """Backward Euler on (N, P) with pymrm newton + NumJac.

    NumJac((1, 2)): the LAST axis is the field index, so the default stencil
    couples the two fields in full and nothing else - the right shape for a
    pointwise source.  A bare (2,) shape would make the last axis "space" and
    build a dense Jacobian; here that is 2x2 either way, but the shape is
    written correctly because it is the one that generalises.
    """
    t_lo = T_LO if t_lo is None else t_lo
    t_hi = T_HI if t_hi is None else t_hi
    dt = (t_hi - t_lo)/nt
    jac = NumJac((1, 2))
    y = np.array([[N_closed(t_lo), P_closed(t_lo, a, b)]])
    for i in range(nt):
        kc = float(KT(np.clip(t_lo + (i + 1)*dt, T_LO, T_HI)))
        y_old = y.copy()

        def src(c):                       # dy/dt = src(y), pointwise in the fields
            N = c[..., 0:1]
            return np.concatenate([kc*N, a*kc*N + b*N], axis=-1)

        def resid(c):
            s, js = jac(src, c.reshape((1, 2)))
            r = (c.reshape((1, 2)) - y_old)/dt - s
            return r.reshape((-1, 1)), np.eye(2)/dt - js.toarray()

        sol = newton(resid, y.reshape((1, 2)), tol=1e-13, maxfev=100)
        assert sol.success, "batch marcher did not converge"
        y = sol.x.reshape((1, 2))
    return y[0]


# ------------------------------------------------ 2. pymrm plug-flow fermenter
class PlugFlowFermenter:
    """Steady 1-D plug flow carrying (N, P) with the Luedeking-Piret source."""

    def __init__(self, ncell, a, b, v=1.0, tau=None, nu=0, kt=None):
        self.tau = (T_HI - T_LO) if tau is None else tau
        self.shape, self.v, self.a, self.b = (ncell, 2), v, a, b
        self.z_f = np.linspace(0.0, v*self.tau, ncell + 1)
        self.z_c = 0.5*(self.z_f[:-1] + self.z_f[1:])
        d0 = np.array([[N_closed(T_LO), P_closed(T_LO, a, b)]])
        # OUTWARD normal, so both dicts read  a dc/dn + b c = d.
        #   z = 0  inlet : outward normal is -z -> Dirichlet feed, a=0, b=1
        #   z = L  outlet: outward normal is +z -> pure outflow, dc/dz = 0
        self.bc = ({"a": 0.0, "b": 1.0, "d": d0},
                   {"a": 1.0, "b": 0.0, "d": 0.0})
        conv, conv_bc = construct_convflux_upwind(self.shape, self.z_f, self.z_c,
                                                  self.bc, v=v, axis=0)
        self.div = construct_div(self.shape, self.z_f, nu=nu, axis=0)  # nu=0 Cartesian
        self.A, self.rhs = self.div @ conv, self.div @ conv_bc
        self.numjac = NumJac(self.shape)      # pointwise in the 2 fields
        # residence time at axial position z is t = T_LO + z/v, so k(z) is a
        # CONSTANT vector assembled once, never inside the Newton loop.  kt is
        # the k(t) interpolant, KT by default; a break row below hands in a
        # CORRUPTED one so that one mis-transcribed k cell drives the solve and
        # the closed form it is scored against at the same time.
        self.k_z = (KT if kt is None else kt)(
            np.clip(T_LO + self.z_c/v, T_LO, T_HI))[:, None]
        self.c0 = np.tile(d0, (ncell, 1))

    def source(self, c):
        N = c[..., 0:1]
        return np.concatenate([self.k_z*N, self.a*self.k_z*N + self.b*N], axis=-1)

    def solve(self):
        def resid(c):
            s, js = self.numjac(self.source, c)
            return (self.rhs + self.A @ c.reshape((-1, 1)) - s.reshape((-1, 1)),
                    self.A - js)
        r = newton(resid, self.c0, maxfev=200)
        assert r.success, "plug-flow solve did not converge"
        self.c = r.x.reshape(self.shape)
        return self

    def outlet(self):
        """via compute_boundary_values, NOT off the last cell centre"""
        return np.asarray(compute_boundary_values(
            self.c, self.z_f, self.z_c, self.bc, axis=0)[2]).reshape(-1)[:2]

    def outlet_last_cell(self):
        """the O(h) read, kept for the comparison in Validation"""
        return self.c[-1].copy()


print("pymrm: NumJac((1,2)) + newton for the batch marcher;"
      "\n       construct_convflux_upwind + construct_div(nu=0) + NumJac((n,2))"
      " + newton\n       for the plug-flow fermenter, outlet via"
      " compute_boundary_values.")
print(f"prescribed k(t): monotone cubic through the {len(_kk)} printed k cells,"
      f" {T_LO:.2f}-{T_HI:.2f} h")
pymrm: NumJac((1,2)) + newton for the batch marcher;
construct_convflux_upwind + construct_div(nu=0) + NumJac((n,2)) + newton
for the plug-flow fermenter, outlet via compute_boundary_values.
prescribed k(t): monotone cubic through the 25 printed k cells, 1.00-13.50 hResults
1. The refit, three ways
Route A is eq. (3) - the authors’ own plotting variables, so it is the closest thing to reproducing their straight edge. Route B is eq. (2), which is the same model weighted by \(N^2\). Route C uses no differentiated column at all: it integrates eq. (2) and fits the measured \(P\) column directly.
All three are fits, and all three are fits to the same fermentation the authors fitted. None of them is a test of the model on new data.
# ---------------------------------------------------------- ROUTE A: eq. (3)
_f3 = T2.dropna(subset=["k_per_h", "invN_dPdt_mg_per_UOD_h"])
K_OBS = _f3.k_per_h.to_numpy()
Y_OBS = _f3.invN_dPdt_mg_per_UOD_h.to_numpy()
N_FIT3 = len(K_OBS)


def ols(X, y):
    c, *_ = np.linalg.lstsq(X, y, rcond=None)
    return c


def fit_eq3(k=K_OBS, y=Y_OBS):
    X = np.column_stack([k, np.ones_like(k)])
    c = ols(X, y)
    r = y - X @ c
    s2 = (r**2).sum()/(len(k) - 2)
    cov = s2*np.linalg.inv(X.T @ X)
    return c, r, cov


C3, R3, COV3 = fit_eq3()
ALPHA_A, BETA_A = float(C3[0]), float(C3[1])
SE_ALPHA, SE_BETA = float(np.sqrt(COV3[0, 0])), float(np.sqrt(COV3[1, 1]))
CORR_AB = float(COV3[0, 1]/np.sqrt(COV3[0, 0]*COV3[1, 1]))
rms = lambda r: float(np.sqrt((np.asarray(r)**2).mean()))
RMS_A = rms(R3)
R2_A = float(1 - (R3**2).sum()/((Y_OBS - Y_OBS.mean())**2).sum())

# ---------------------------------------------------------- ROUTE B: eq. (2)
_f2 = T2.dropna(subset=["N_UOD_per_ml", "dNdt_UOD_per_ml_h", "dPdt_mg_per_ml_h"])
DN_OBS = _f2.dNdt_UOD_per_ml_h.to_numpy()
N_OBS = _f2.N_UOD_per_ml.to_numpy()
DP_OBS = _f2.dPdt_mg_per_ml_h.to_numpy()
X2 = np.column_stack([DN_OBS, N_OBS])
C2 = ols(X2, DP_OBS)
ALPHA_B, BETA_B = float(C2[0]), float(C2[1])
RMS_B = rms(DP_OBS - X2 @ C2)
R2_B = float(1 - ((DP_OBS - X2 @ C2)**2).sum()/((DP_OBS - DP_OBS.mean())**2).sum())

# ------------------------- ROUTE C: the INTEGRAL form, no differentiated column
_fp = T2.dropna(subset=["P_mg_per_ml"])
_fp = _fp[_fp.time_h <= T_HI]
TP = _fp.time_h.to_numpy()
P_OBS = _fp.P_mg_per_ml.to_numpy()
TP0, P0_OBS = float(TP[0]), float(P_OBS[0])
DN_INT = NT2(TP) - NT2(TP0)                    # N(t) - N(t_0), printed N column
IN_INT = NT2_INT(TP) - NT2_INT(TP0)            # int N dt
XC = np.column_stack([DN_INT, IN_INT])
CC = ols(XC, P_OBS - P0_OBS)
ALPHA_C, BETA_C = float(CC[0]), float(CC[1])
RMS_C = rms(P_OBS - P0_OBS - XC @ CC)

REL = lambda x, ref: float(x/ref - 1.0)
A_REL_A, B_REL_A = REL(ALPHA_A, ALPHA_PRINTED), REL(BETA_A, BETA_PRINTED)
A_REL_B, B_REL_B = REL(ALPHA_B, ALPHA_PRINTED), REL(BETA_B, BETA_PRINTED)
A_REL_C, B_REL_C = REL(ALPHA_C, ALPHA_PRINTED), REL(BETA_C, BETA_PRINTED)
ALPHA_SPREAD = float(max(ALPHA_A, ALPHA_B, ALPHA_C)/min(ALPHA_A, ALPHA_B, ALPHA_C) - 1)
BETA_SPREAD = float(max(BETA_A, BETA_B, BETA_C)/min(BETA_A, BETA_B, BETA_C) - 1)

print("REFIT OF THE pH 6.0 RUN - three routes, all of them FITS, none a test:\n")
print(f"{'route':44s} {'alpha':>10s} {'beta':>10s}   rms")
print(f"{'A  eq.(3) OLS, the authors own axes (Fig. 11)':44s}"
      f" {ALPHA_A:10.6f} {BETA_A:10.6f}   {RMS_A:.6f} mg/U.O.D. h")
print(f"{'B  eq.(2) OLS, i.e. eq.(3) weighted by N^2':44s}"
      f" {ALPHA_B:10.6f} {BETA_B:10.6f}   {RMS_B:.6f} mg/ml h")
print(f"{'C  integral form, NO differentiated column':44s}"
      f" {ALPHA_C:10.6f} {BETA_C:10.6f}   {RMS_C:.6f} mg/ml")
print(f"{'   PRINTED, Table III pH 6.0':44s}"
      f" {ALPHA_PRINTED:10.6f} {BETA_PRINTED:10.6f}")
print(f"\nagainst the printed pair:  A {A_REL_A:+.4%} / {B_REL_A:+.4%}"
      f"   B {A_REL_B:+.4%} / {B_REL_B:+.4%}   C {A_REL_C:+.4%} / {B_REL_C:+.4%}")
print(f"spread across the three routes: alpha {ALPHA_SPREAD:.4%},"
      f" beta {BETA_SPREAD:.4%}")
print(f"\nROUTE A standard errors: alpha {ALPHA_A:.6f} +- {SE_ALPHA:.6f},"
      f" beta {BETA_A:.6f} +- {SE_BETA:.6f}")
SE_ALPHA_DIST = float(abs(ALPHA_A - ALPHA_PRINTED)/SE_ALPHA)
SE_BETA_DIST = float(abs(BETA_A - BETA_PRINTED)/SE_BETA)
print(f"  the printed {ALPHA_PRINTED} is {SE_ALPHA_DIST:.4f} standard errors from"
      f" the fitted alpha,\n  and the printed {BETA_PRINTED} is"
      f" {SE_BETA_DIST:.4f} from the fitted beta - BOTH INSIDE ONE.")
print(f"  corr(alpha, beta) = {CORR_AB:.6f}: the two constants trade off, so the"
      f" pair matters\n  more than either number alone.  That is priced next.")
REFIT OF THE pH 6.0 RUN - three routes, all of them FITS, none a test:
route alpha beta rms
A eq.(3) OLS, the authors own axes (Fig. 11) 2.266562 0.528684 0.100792 mg/U.O.D. h
B eq.(2) OLS, i.e. eq.(3) weighted by N^2 2.289913 0.510117 0.323004 mg/ml h
C integral form, NO differentiated column 2.272660 0.510150 0.153769 mg/ml
PRINTED, Table III pH 6.0 2.200000 0.550000
against the printed pair: A +3.0256% / -3.8757% B +4.0870% / -7.2514% C +3.3027% / -7.2455%
spread across the three routes: alpha 1.0302%, beta 3.6396%
ROUTE A standard errors: alpha 2.266562 +- 0.130928, beta 0.528684 +- 0.049837
the printed 2.2 is 0.5084 standard errors from the fitted alpha,
and the printed 0.55 is 0.4277 from the fitted beta - BOTH INSIDE ONE.
corr(alpha, beta) = -0.891902: the two constants trade off, so the pair matters
more than either number alone. That is priced next.2. The printed pair sits on the ridge
\(\alpha\) and \(\beta\) are strongly anticorrelated in this fit, so quoting “+3 % on \(\alpha\), −4 % on \(\beta\)” overstates the disagreement: those two errors largely cancel. The honest measures are (i) what one constant becomes when the other is held at the authors’ value, and (ii) what their pair costs in residual against the least-squares optimum.
# beta refitted with alpha held at the printed value, and vice versa
BETA_GIVEN_ALPHA = float(np.mean(Y_OBS - ALPHA_PRINTED*K_OBS))
ALPHA_GIVEN_BETA = float(np.sum(K_OBS*(Y_OBS - BETA_PRINTED))/np.sum(K_OBS**2))
BETA_GIVEN_ALPHA_REL = REL(BETA_GIVEN_ALPHA, BETA_PRINTED)
ALPHA_GIVEN_BETA_REL = REL(ALPHA_GIVEN_BETA, ALPHA_PRINTED)
RMS_PRINTED = rms(Y_OBS - ALPHA_PRINTED*K_OBS - BETA_PRINTED)
RMS_PENALTY = float(RMS_PRINTED/RMS_A - 1.0)
print(f"beta refitted with alpha HELD at the printed {ALPHA_PRINTED}:"
      f" {BETA_GIVEN_ALPHA:.6f}"
      f"  ({BETA_GIVEN_ALPHA_REL:+.4%} from the printed {BETA_PRINTED})")
print(f"alpha refitted with beta HELD at the printed {BETA_PRINTED}:"
      f" {ALPHA_GIVEN_BETA:.6f}"
      f"  ({ALPHA_GIVEN_BETA_REL:+.4%} from the printed {ALPHA_PRINTED})")
print(f"\nrms of eq.(3) residuals: least squares {RMS_A:.6f},"
      f" the printed pair {RMS_PRINTED:.6f}")
print(f"  -> the authors' straight-edge fit costs {RMS_PENALTY:.4%} in rms against"
      f" the optimum.")
print("  Their eyeballed line off Fig. 11 is statistically indistinguishable from"
      "\n  ordinary least squares on the same 22 points.  THAT IS THE HEADLINE, and"
      "\n  it is a consistency result about their fitting, not about their model.")
beta refitted with alpha HELD at the printed 2.2: 0.551282 (+0.2331% from the printed 0.55)
alpha refitted with beta HELD at the printed 0.55: 2.216616 (+0.7553% from the printed 2.2)
rms of eq.(3) residuals: least squares 0.100792, the printed pair 0.101450
-> the authors' straight-edge fit costs 0.6521% in rms against the optimum.
Their eyeballed line off Fig. 11 is statistically indistinguishable from
ordinary least squares on the same 22 points. THAT IS THE HEADLINE, and
it is a consistency result about their fitting, not about their model.3. The two nulls, in both of the windows the paper distinguishes
Each null is one of the two statements the paper itself names on book p. 410 and then rejects. They are fitted the same way, with their own best constant, so the comparison is between models and not between a model and a bad guess.
The direction of every ratio below is algebraically guaranteed and carries no information. Each null is an exactly nested submodel of the two-term fit - same rows, same variables, one coefficient set to zero - so its residual sum cannot be smaller and rms_null / rms_two-term \(\ge 1\) by construction. Only the magnitude is a finding, and a ratio near 1 would be a real result: it would say the second term earns nothing.
Which is exactly what the paper says happens in the logarithmic phase, and that half of its sentence is tested here too. Book p. 410 says the two one-term forms “are both valid” while \(k\) is constant, “neither” holding outside that window. So the ratios are computed three times: over all the rows, over the logarithmic plateau alone, and over the rows outside it. The split is made at \(k = 0{\cdot}45\), which is not a tuned threshold - the printed \(k\) column has a gap there, and every row above it lies in a narrow plateau whose width is printed below. That plateau is the paper’s \(k_c\).
# --- nulls in eq. (2)'s variables (rate form) -------------------------------
A_ONLY = float(ols(X2[:, [0]], DP_OBS)[0])          # dP/dt = alpha dN/dt
B_ONLY = float(ols(X2[:, [1]], DP_OBS)[0])          # dP/dt = beta N
RMS_A_ONLY = rms(DP_OBS - A_ONLY*X2[:, 0])
RMS_B_ONLY = rms(DP_OBS - B_ONLY*X2[:, 1])
GAIN_A_ONLY = float(RMS_A_ONLY/RMS_B)
GAIN_B_ONLY = float(RMS_B_ONLY/RMS_B)
R2_A_ONLY = float(1 - ((DP_OBS - A_ONLY*X2[:, 0])**2).sum()
                  / ((DP_OBS - DP_OBS.mean())**2).sum())
R2_B_ONLY = float(1 - ((DP_OBS - B_ONLY*X2[:, 1])**2).sum()
                  / ((DP_OBS - DP_OBS.mean())**2).sum())

# --- nulls in the integral form (P itself) ---------------------------------
A_ONLY_INT = float(ols(XC[:, [0]], P_OBS - P0_OBS)[0])
B_ONLY_INT = float(ols(XC[:, [1]], P_OBS - P0_OBS)[0])
RMS_A_ONLY_INT = rms(P_OBS - P0_OBS - A_ONLY_INT*XC[:, 0])
RMS_B_ONLY_INT = rms(P_OBS - P0_OBS - B_ONLY_INT*XC[:, 1])
GAIN_A_ONLY_INT = float(RMS_A_ONLY_INT/RMS_C)
GAIN_B_ONLY_INT = float(RMS_B_ONLY_INT/RMS_C)

print("NULL BASELINES - both are the paper's own two rejected statements.\n")
print(f"{'model':52s} {'best constant':>14s} {'rms':>10s} {'x two-term':>11s}")
print(f"{'RATE FORM, eq. (2) variables, mg/ml h':52s}")
print(f"{'  dP/dt = alpha dN/dt + beta N   (two-term)':52s}"
      f" {'':>14s} {RMS_B:10.6f} {1.0:11.4f}")
print(f"{'  dP/dt = alpha dN/dt            (beta = 0)':52s}"
      f" {A_ONLY:14.6f} {RMS_A_ONLY:10.6f} {GAIN_A_ONLY:11.4f}")
print(f"{'  dP/dt = beta N                 (alpha = 0)':52s}"
      f" {B_ONLY:14.6f} {RMS_B_ONLY:10.6f} {GAIN_B_ONLY:11.4f}")
print(f"{'INTEGRAL FORM, P itself, mg/ml':52s}")
print(f"{'  P = P0 + alpha dN + beta int N dt':52s}"
      f" {'':>14s} {RMS_C:10.6f} {1.0:11.4f}")
print(f"{'  P = P0 + alpha dN':52s}"
      f" {A_ONLY_INT:14.6f} {RMS_A_ONLY_INT:10.6f} {GAIN_A_ONLY_INT:11.4f}")
print(f"{'  P = P0 + beta int N dt':52s}"
      f" {B_ONLY_INT:14.6f} {RMS_B_ONLY_INT:10.6f} {GAIN_B_ONLY_INT:11.4f}")
print(f"\nR^2 in the rate form: two-term {R2_B:.6f}, growth-only {R2_A_ONLY:.6f},"
      f" density-only {R2_B_ONLY:.6f}.")
print("R^2 FLATTERS EVERY MODEL IN THE INTEGRAL FORM, because P(t) is dominated by"
      "\nits monotone rise - which is why the rms ratios above are the numbers"
      " reported\nand the integral R^2 is not.")
print("EVERY RATIO ABOVE IS >= 1 BY CONSTRUCTION - each null is an exactly nested"
      "\nsubmodel of the two-term fit on the same rows - so the direction is"
      " algebra and\nonly the MAGNITUDE is a finding.  Which makes the next block"
      " the real test:\nthe paper says both one-term forms ARE valid inside the"
      " logarithmic phase.")


# ---- the paper's own qualifier, made quantitative in BOTH directions -------
def null_split(df, k_min=None, k_max=None):
    """Refit the two-term form and both nulls on a k-window of the rate data."""
    f = df
    if k_min is not None:
        f = f[f.k_per_h >= k_min]
    if k_max is not None:
        f = f[f.k_per_h < k_max]
    x = np.column_stack([f.dNdt_UOD_per_ml_h.to_numpy(), f.N_UOD_per_ml.to_numpy()])
    y = f.dPdt_mg_per_ml_h.to_numpy()
    c = ols(x, y)
    r2 = rms(y - x @ c)
    a1 = float(ols(x[:, [0]], y)[0])
    b1 = float(ols(x[:, [1]], y)[0])
    return (len(f), r2, float(rms(y - a1*x[:, 0])/r2), float(rms(y - b1*x[:, 1])/r2),
            float(c[0]), float(c[1]))


K_LOG = 0.45                       # the gap in the printed k column, not a fit
_kv = np.sort(_f2.k_per_h.to_numpy())
K_PLATEAU_LO, K_PLATEAU_HI = float(_kv[_kv >= K_LOG].min()), float(_kv.max())
K_PLATEAU_SPREAD = float(K_PLATEAU_HI/K_PLATEAU_LO - 1)
K_GAP_LO = float(_kv[_kv < K_LOG].max())
(N_ALL, RMS2_ALL, GAIN_A_ALL, GAIN_B_ALL, _, _) = null_split(_f2)
(N_LOG, RMS2_LOG, GAIN_A_LOG, GAIN_B_LOG,
 ALPHA_LOG, BETA_LOG) = null_split(_f2, k_min=K_LOG)
(N_OUT, RMS2_OUT, GAIN_A_OUT, GAIN_B_OUT, _, _) = null_split(_f2, k_max=K_LOG)
N_OUT_EARLY = int((_f2[_f2.k_per_h < K_LOG].time_h
                   < _f2[_f2.k_per_h >= K_LOG].time_h.min()).sum())
print(f"\nTHE PAPER'S OWN QUALIFIER, MEASURED (book p. 410: the two one-term forms"
      f"\nare BOTH VALID while k is constant, and NEITHER holds outside that"
      f" window).")
print(f"the printed k column jumps from {K_GAP_LO} to {K_PLATEAU_LO} with nothing"
      f" between,\nand every row above the gap has k in"
      f" [{K_PLATEAU_LO}, {K_PLATEAU_HI}] - a spread of {K_PLATEAU_SPREAD:.4%}."
      f"  THAT PLATEAU IS THE PAPER'S k_c.\n")
print(f"{'rows':44s} {'n':>3s} {'two-term rms':>13s} {'x growth-only':>14s}"
      f" {'x density-only':>15s}")
for lbl, n, r_, ga, gb in (
        (f"all rows", N_ALL, RMS2_ALL, GAIN_A_ALL, GAIN_B_ALL),
        (f"logarithmic plateau, k >= {K_LOG}", N_LOG, RMS2_LOG, GAIN_A_LOG,
         GAIN_B_LOG),
        (f"outside it, k < {K_LOG}", N_OUT, RMS2_OUT, GAIN_A_OUT, GAIN_B_OUT)):
    print(f"{lbl:44s} {n:3d} {r_:13.6f} {ga:14.6f} {gb:15.6f}")
print(f"\nINSIDE the window the paper says the one-term forms hold, they cost"
      f" {GAIN_A_LOG - 1:.2%} and\n{GAIN_B_LOG - 1:.2%} in rms - i.e. essentially"
      f" nothing, exactly as stated.  OUTSIDE it they cost\n{GAIN_A_OUT:.2f}x and"
      f" {GAIN_B_OUT:.2f}x.  The paper's sentence is now quantitative in BOTH"
      f"\ndirections, which the single all-rows ratios of {GAIN_A_ALL:.2f}x and"
      f" {GAIN_B_ALL:.2f}x are not:\nthose average the two regimes and get their"
      f" size from the second one alone.")
print(f"  ({N_OUT} rows sit outside the plateau, {N_OUT_EARLY} of them BEFORE it"
      f" - the lag-phase\n  t = 2.50 h row - so \"outside\" is not the same as"
      f" \"after\", and it is not called that.)")
print(f"  WHY THE TWO CONSTANTS ARE NEARLY UNIDENTIFIABLE THERE: on the plateau"
      f" dN/dt = k_c N,\n  so the two regressors are proportional and the fit"
      f" returns alpha = {ALPHA_LOG:.6f},\n  beta = {BETA_LOG:.6f} - nothing like"
      f" the printed pair, and the log-phase-only break row\n  moves alpha_se_eq3"
      f" by more than an order of magnitude.  A ratio near 1 here is\n  degeneracy,"
      f" not agreement, and that is what the paper is describing.")
NULL BASELINES - both are the paper's own two rejected statements.
model best constant rms x two-term
RATE FORM, eq. (2) variables, mg/ml h
dP/dt = alpha dN/dt + beta N (two-term) 0.323004 1.0000
dP/dt = alpha dN/dt (beta = 0) 4.255537 1.792661 5.5500
dP/dt = beta N (alpha = 0) 0.850473 1.587814 4.9158
INTEGRAL FORM, P itself, mg/ml
P = P0 + alpha dN + beta int N dt 0.153769 1.0000
P = P0 + alpha dN 4.039173 2.189919 14.2416
P = P0 + beta int N dt 1.130276 2.736164 17.7940
R^2 in the rate form: two-term 0.983187, growth-only 0.482138, density-only 0.593728.
R^2 FLATTERS EVERY MODEL IN THE INTEGRAL FORM, because P(t) is dominated by
its monotone rise - which is why the rms ratios above are the numbers reported
and the integral R^2 is not.
EVERY RATIO ABOVE IS >= 1 BY CONSTRUCTION - each null is an exactly nested
submodel of the two-term fit on the same rows - so the direction is algebra and
only the MAGNITUDE is a finding. Which makes the next block the real test:
the paper says both one-term forms ARE valid inside the logarithmic phase.
THE PAPER'S OWN QUALIFIER, MEASURED (book p. 410: the two one-term forms
are BOTH VALID while k is constant, and NEITHER holds outside that window).
the printed k column jumps from 0.4 to 0.46 with nothing between,
and every row above the gap has k in [0.46, 0.48] - a spread of 4.3478%. THAT PLATEAU IS THE PAPER'S k_c.
rows n two-term rms x growth-only x density-only
all rows 22 0.323004 5.549971 4.915776
logarithmic plateau, k >= 0.45 12 0.102155 1.036042 1.033197
outside it, k < 0.45 10 0.447426 5.011873 3.708246
INSIDE the window the paper says the one-term forms hold, they cost 3.60% and
3.32% in rms - i.e. essentially nothing, exactly as stated. OUTSIDE it they cost
5.01x and 3.71x. The paper's sentence is now quantitative in BOTH
directions, which the single all-rows ratios of 5.55x and 4.92x are not:
those average the two regimes and get their size from the second one alone.
(10 rows sit outside the plateau, 1 of them BEFORE it - the lag-phase
t = 2.50 h row - so "outside" is not the same as "after", and it is not called that.)
WHY THE TWO CONSTANTS ARE NEARLY UNIDENTIFIABLE THERE: on the plateau dN/dt = k_c N,
so the two regressors are proportional and the fit returns alpha = 1.614396,
beta = 0.792957 - nothing like the printed pair, and the log-phase-only break row
moves alpha_se_eq3 by more than an order of magnitude. A ratio near 1 here is
degeneracy, not agreement, and that is what the paper is describing.4. The integral test: does the model reproduce the measured acid curve?
The constants were fitted in the differentiated variables. The \(P\) column was not used in Route A or Route B. Feeding the authors’ own printed constants into the integrated eq. (2), with \(N\) taken from Table II’s own \(N\) column, therefore predicts a curve that no fit was tuned to.
It is still not an independent dataset. Table II’s \(\mathrm{d}P/\mathrm{d}t\) column is the \(P\) column graphically differentiated (book p. 400), so this is the same measurements reduced a different way - a coherence check between two reductions of one run, not a validation. Labelled accordingly.
P_PRED_PRINTED = P0_OBS + ALPHA_PRINTED*DN_INT + BETA_PRINTED*IN_INT
P_PRED_REFIT = P0_OBS + ALPHA_A*DN_INT + BETA_A*IN_INT
_m = TP > TP0
CURVE_MAX = float(np.abs(P_PRED_PRINTED[_m]/P_OBS[_m] - 1).max())
CURVE_AT = float(TP[_m][np.abs(P_PRED_PRINTED[_m]/P_OBS[_m] - 1).argmax()])
CURVE_RMS = rms(P_PRED_PRINTED[_m]/P_OBS[_m] - 1)
P_FINAL_PRED = float(P_PRED_PRINTED[-1])
P_FINAL_OBS = float(P_OBS[-1])
P_FINAL_REL = REL(P_FINAL_PRED, P_FINAL_OBS)
CURVE_MAX_REFIT = float(np.abs(P_PRED_REFIT[_m]/P_OBS[_m] - 1).max())
CURVE_RMS_REFIT = rms(P_PRED_REFIT[_m]/P_OBS[_m] - 1)
print(f"integrated eq. (2) with the AUTHORS' printed {ALPHA_PRINTED} and"
      f" {BETA_PRINTED},\nstarting from the first printed P"
      f" ({P0_OBS} mg/ml at t = {TP0} h), against the {int(_m.sum())} later"
      f" printed P values:")
print(f"  rms relative error {CURVE_RMS:.6f}, worst {CURVE_MAX:.6f}"
      f" at t = {CURVE_AT:.2f} h")
print(f"  final acid: predicted {P_FINAL_PRED:.6f} against the printed"
      f" {P_FINAL_OBS} mg/ml, {P_FINAL_REL:+.4%}")
print(f"  with this page's refitted pair instead: rms {CURVE_RMS_REFIT:.6f},"
      f" worst {CURVE_MAX_REFIT:.6f}")
print("\nCONTEXT FOR THOSE PER CENTS, from the paper itself (book p. 400):"
      "\n  the dilution and sampling corrections, \"if neglected, can be as high as"
      "\n  15-20 per cent\", and lactic recoveries \"ran consistently above 96 per"
      "\n  cent\".  A 3 % closure on the final acid is inside the paper's own"
      "\n  analytical error, which is why it is reported as a coherence check and"
      "\n  not as a precision claim.")
integrated eq. (2) with the AUTHORS' printed 2.2 and 0.55,
starting from the first printed P (0.8 mg/ml at t = 2.5 h), against the 21 later printed P values:
rms relative error 0.016979, worst 0.038359 at t = 6.50 h
final acid: predicted 44.649542 against the printed 43.3 mg/ml, +3.1167%
with this page's refitted pair instead: rms 0.015474, worst 0.033901
CONTEXT FOR THOSE PER CENTS, from the paper itself (book p. 400):
the dilution and sampling corrections, "if neglected, can be as high as
15-20 per cent", and lactic recoveries "ran consistently above 96 per
cent". A 3 % closure on the final acid is inside the paper's own
analytical error, which is why it is reported as a coherence check and
not as a precision claim.5. The crossover the paper describes in words
“In the early phases … the first term of equation 3 is the important one, while towards the end of the fermentation the second term becomes more important.” The two terms are equal at \(k^{*} = \beta/\alpha\). The time at which the pH 6·0 run crosses it is root-found twice, on two column pairs that share nothing: once on the printed \(k\) column, and once on the separate printed \(\mathrm{d}N/\mathrm{d}t\) and \(N\) columns, where the condition is \(\alpha\,\mathrm{d}N/\mathrm{d}t = \beta N\).
K_STAR_PRINTED = float(BETA_PRINTED/ALPHA_PRINTED)
K_STAR_REFIT = float(BETA_A/ALPHA_A)

# ROUTE 1: root-find on the printed k column
T_CROSS_K = float(brentq(lambda t: float(KT(t)) - K_STAR_PRINTED, 9.0, 13.0,
                         xtol=1e-13, rtol=1e-15))
# ROUTE 2: root-find on the SEPARATE printed dN/dt and N columns.  Different
# cells of the table, a different interpolant, and never a quotient - so a
# mis-transcribed k cell moves one route and not the other.
_d = T2.dropna(subset=["dNdt_UOD_per_ml_h", "N_UOD_per_ml"])
DNT = PchipInterpolator(_d.time_h.to_numpy(), _d.dNdt_UOD_per_ml_h.to_numpy())
NNT = PchipInterpolator(_d.time_h.to_numpy(), _d.N_UOD_per_ml.to_numpy())
T_CROSS_D = float(brentq(
    lambda t: ALPHA_PRINTED*float(DNT(t)) - BETA_PRINTED*float(NNT(t)),
    9.0, 13.0, xtol=1e-13, rtol=1e-15))
CROSS_TWO_ROUTES = float(abs(T_CROSS_K/T_CROSS_D - 1.0))
T_CROSS_FRAC = float((T_CROSS_K - T_LO)/(T_HI - T_LO))

# the split of the acid actually made, over the tabulated window
GA = float(ALPHA_PRINTED*np.trapezoid(DN_OBS, _f2.time_h.to_numpy()))
NG = float(BETA_PRINTED*np.trapezoid(N_OBS, _f2.time_h.to_numpy()))
TOT_MODEL = GA + NG
TOT_OBS = float(np.trapezoid(DP_OBS, _f2.time_h.to_numpy()))
GA_SHARE = float(GA/TOT_MODEL)
CLOSURE_REL = float(TOT_MODEL/TOT_OBS - 1.0)

# HOW WELL IS t* ACTUALLY DETERMINED?  Not to the seven figures the root-find
# returns: both routes read the same printed cells through an INTERPOLANT, and
# swapping it for a linear one moves both.  That spread, not the agreement
# between the routes, is the band on t*.
_klin = np.linspace(T_LO, T_HI, 200001)
KT_LIN = PchipInterpolator(_klin, np.interp(_klin, _kk.time_h.to_numpy(),
                                            _kk.k_per_h.to_numpy()))
T_CROSS_K_LIN = float(brentq(lambda t: float(KT_LIN(t)) - K_STAR_PRINTED,
                             9.0, 13.0, xtol=1e-13, rtol=1e-15))
T_CROSS_INTERP_BAND = float(abs(T_CROSS_K_LIN/T_CROSS_K - 1.0))

print(f"k* = beta/alpha at pH 6.0: printed pair {K_STAR_PRINTED:.6f} 1/h,"
      f" refitted pair {K_STAR_REFIT:.6f} 1/h")
print(f"\ncrossover time, ROOT-FOUND (never a swept crossing), two independent"
      f" column paths:")
print(f"  on the printed k column                   t = {T_CROSS_K:.6f} h")
print(f"  on the printed dN/dt and N columns        t = {T_CROSS_D:.6f} h")
print(f"  the two routes differ by {CROSS_TWO_ROUTES:.3e} relative")
print(f"  -> {T_CROSS_FRAC:.4%} of the way through the tabulated"
      f" {T_LO:.2f}-{T_HI:.2f} h window,\n     which is the paper's \"towards the"
      f" end\" made into a number.")
print(f"\nWHAT THAT {CROSS_TWO_ROUTES:.3e} IS AND IS NOT.  It is a"
      f" TRANSCRIPTION-CONSISTENCY RESIDUAL:\n  the two routes read different"
      f" printed cells, so a mis-transcribed k cell moves one\n  and not the"
      f" other, and a break row that takes the second route on the first"
      f"\n  route's column collapses it to zero.  IT IS NOT THE PRECISION OF"
      f" t*.  Re-running\n  route 1 through a LINEAR interpolant instead of the"
      f" monotone cubic gives"
      f"\n  t = {T_CROSS_K_LIN:.6f} h, {T_CROSS_INTERP_BAND:.2%} away - two"
      f" orders of magnitude wider than the\n  agreement between the routes."
      f"  And a single mis-transcribed Table III cell moves it\n  further still"
      f" (the break table prices that below).  SO t* IS QUOTED AS"
      f" ~{T_CROSS_K:.1f} h\n  with that band, and never to the digits brentq"
      f" returns.")
print(f"\nover that whole window, with the printed constants:")
print(f"  growth-associated   alpha int dN = {GA:.6f} mg/ml   ({GA_SHARE:.4%})")
print(f"  non-growth          beta  int N dt = {NG:.6f} mg/ml   ({1-GA_SHARE:.4%})")
print(f"  sum {TOT_MODEL:.6f} against int dP/dt = {TOT_OBS:.6f} mg/ml,"
      f" {CLOSURE_REL:+.4%}")
print("  SO THE TWO MECHANISMS CONTRIBUTE ALMOST EQUALLY OVER A WHOLE BATCH, even"
      "\n  though each dominates half of it.  Neither term is a correction.")
k* = beta/alpha at pH 6.0: printed pair 0.250000 1/h, refitted pair 0.233254 1/h
crossover time, ROOT-FOUND (never a swept crossing), two independent column paths:
on the printed k column t = 10.102704 h
on the printed dN/dt and N columns t = 10.102952 h
the two routes differ by 2.450e-05 relative
-> 72.8216% of the way through the tabulated 1.00-13.50 h window,
which is the paper's "towards the end" made into a number.
WHAT THAT 2.450e-05 IS AND IS NOT. It is a TRANSCRIPTION-CONSISTENCY RESIDUAL:
the two routes read different printed cells, so a mis-transcribed k cell moves one
and not the other, and a break row that takes the second route on the first
route's column collapses it to zero. IT IS NOT THE PRECISION OF t*. Re-running
route 1 through a LINEAR interpolant instead of the monotone cubic gives
t = 10.119048 h, 0.16% away - two orders of magnitude wider than the
agreement between the routes. And a single mis-transcribed Table III cell moves it
further still (the break table prices that below). SO t* IS QUOTED AS ~10.1 h
with that band, and never to the digits brentq returns.
over that whole window, with the printed constants:
growth-associated alpha int dN = 20.724000 mg/ml (46.6929%)
non-growth beta int N dt = 23.659625 mg/ml (53.3071%)
sum 44.383625 against int dP/dt = 43.630000 mg/ml, +1.7273%
SO THE TWO MECHANISMS CONTRIBUTE ALMOST EQUALLY OVER A WHOLE BATCH, even
though each dominates half of it. Neither term is a correction.6. The six pH levels - what six pairs can and cannot say
This is the part of the case the queue entry was written for, and it is also where the scope boundary bites. Five of these six rows have no printed raw data, so five of them cannot be refitted, cannot be residual-checked, and cannot be tested at all here. What can be done with six numbers is to state their trends and to say what those trends do not establish.
# ---- the one column of Table III that is printed TWICE in this paper --------
# Book p. 400, running text: the six fermentations were "each of which was
# continuously controlled at a different pH level (6.0, 5.6, 5.4, 5.2, 4.8 and
# 4.5)".  That sentence is an EXTERNAL check on Table III's pH column - a third
# of the table's cells - and it is asserted here rather than described.
PH_RUNNING_TEXT_P400 = (6.0, 5.6, 5.4, 5.2, 4.8, 4.5)
PH_TABLE_III = tuple(float(x) for x in
                     T3.sort_values("pH", ascending=False).pH.to_numpy())
assert PH_TABLE_III == PH_RUNNING_TEXT_P400, (
    "Table III's pH column no longer matches the six levels printed in the"
    " running text on book p. 400")
print(f"Table III's pH column {PH_TABLE_III}\nmatches the six levels printed"
      f" again in running text on book p. 400: EXTERNAL CHECK PASSES.\n"
      f"(The alpha and beta columns have no second printing anywhere in the"
      f" paper.)\n")

T3S = T3.sort_values("pH", ascending=False).reset_index(drop=True)
T3S["k_star_per_h"] = T3S.beta_mg_lactic_per_UOD_h/T3S.alpha_mg_lactic_per_UOD
BETA_MONOTONE = bool(np.all(np.diff(T3S.beta_mg_lactic_per_UOD_h.to_numpy()) < 0))
ALPHA_MONOTONE = bool(np.all(np.diff(T3S.alpha_mg_lactic_per_UOD.to_numpy()) >= 0))
KSTAR_MONOTONE = bool(np.all(np.diff(T3S.k_star_per_h.to_numpy()) < 0))
BETA_RANGE = float(T3S.beta_mg_lactic_per_UOD_h.iloc[0]
                   / T3S.beta_mg_lactic_per_UOD_h.iloc[-1])
ALPHA_RANGE = float(T3S.alpha_mg_lactic_per_UOD.iloc[-1]
                    / T3S.alpha_mg_lactic_per_UOD.iloc[0])
KSTAR_RANGE = float(T3S.k_star_per_h.iloc[0]/T3S.k_star_per_h.iloc[-1])
ALPHA_FLAT_N = int((T3S.alpha_mg_lactic_per_UOD
                    == T3S.alpha_mg_lactic_per_UOD.iloc[0]).sum())
print("Table III, with beta/alpha computed (the paper prints neither the ratio nor"
      "\nany other derived column - see the sidecar on why nothing here checks"
      " itself):\n")
print(f"{'pH':>5s} {'alpha':>8s} {'beta':>8s} {'k* = beta/alpha, 1/h':>22s}")
for _, r in T3S.iterrows():
    print(f"{r.pH:5.1f} {r.alpha_mg_lactic_per_UOD:8.2f}"
          f" {r.beta_mg_lactic_per_UOD_h:8.2f} {r.k_star_per_h:22.6f}")
print(f"\nbeta strictly decreasing as pH falls: {BETA_MONOTONE}"
      f"  -  a factor of {BETA_RANGE:.4f} over the range")
print(f"alpha non-decreasing as pH falls:     {ALPHA_MONOTONE}"
      f"  -  a factor of {ALPHA_RANGE:.6f}, and FLAT at"
      f" {T3S.alpha_mg_lactic_per_UOD.iloc[0]} for the top {ALPHA_FLAT_N} levels")
print(f"k* strictly decreasing as pH falls:   {KSTAR_MONOTONE}"
      f"  -  a factor of {KSTAR_RANGE:.6f}")
print("\nWHAT THAT MEANS PHYSICALLY: as the pH falls, the non-growth route to acid"
      "\nis shut down five-fold while the growth-associated yield rises only 1.6"
      " fold,\nso the fermentation becomes almost purely growth-associated - at pH"
      f" 4.5 the\ntwo terms are equal only at k = {T3S.k_star_per_h.iloc[-1]:.6f}"
      f" 1/h, {KSTAR_RANGE:.2f}x lower than at pH 6.0.")
print("\nWHAT SIX PAIRS DO NOT ESTABLISH, and this page does not claim:"
      "\n  * NOT that the FORM holds at the other five pH levels.  The form is"
      " tested by\n    the linearity of (1/N)(dP/dt) against k, which is Fig. 11,"
      " and only the\n    pH 6.0 run's points are printed.  Six fitted pairs are"
      " six OUTPUTS of that\n    test, not the test."
      "\n  * NOT a functional form for alpha(pH) or beta(pH).  Six points, no"
      " replicates,\n    no stated uncertainty on any of them, and the paper itself"
      " only plots them\n    (Fig. 10) and reads an inflection off the plot."
      "\n  * NOT that pH 5.4 is special.  The paper says a change of behaviour"
      " occurs\n    there and locates an inflection of alpha(pH) at that pH from"
      " Fig. 10; with\n    three of the six alpha values printed as the SAME"
      " number, 2.2, nothing in\n    Table III alone can put an inflection"
      " anywhere.")
assert BETA_MONOTONE and ALPHA_MONOTONE and KSTAR_MONOTONE

# ---- WHY THIS CELL IS ALSO THE ARITHMETIC SETTLEMENT OF THE pH 5.6 MARK ----
# The stray mark before that cell's leading zero could only be a sign.  Read it
# as one and the assertion two lines above FAILS, so the notebook would not
# execute at all.  Demonstrated rather than asserted:
_minus = T3.copy()
_minus.loc[_minus.pH == 5.6, "beta_mg_lactic_per_UOD_h"] = -0.49
_ms = _minus.sort_values("pH", ascending=False).beta_mg_lactic_per_UOD_h.to_numpy()
BETA_MONOTONE_IF_MINUS = bool(np.all(np.diff(_ms) < 0))
assert BETA_MONOTONE and not BETA_MONOTONE_IF_MINUS
print(f"\nTHE pH 5.6 MARK, SETTLED BY ARITHMETIC AND NOT BY PIXELS:"
      f"\n  beta strictly decreasing with the mark read as a DOT   (0.49):"
      f" {BETA_MONOTONE}"
      f"\n  beta strictly decreasing with the mark read as a MINUS (-0.49):"
      f" {BETA_MONOTONE_IF_MINUS}"
      f"\n  -> the minus reading breaks the assertion this cell just executed,"
      f" and the\n     break row below prices the violation on"
      f" beta_monotone_margin.  The paper's own\n     Fig. 10 (book p. 407)"
      f" plots this column on a ZERO-BASED axis with all six\n     points above"
      f" the axis, which says the same thing independently.  The"
      f"\n     connected-component measurement on the crop CORROBORATES a"
      f" conclusion two\n     arithmetic checks already reach; it does not carry"
      f" it alone.")
Table III's pH column (6.0, 5.6, 5.4, 5.2, 4.8, 4.5)
matches the six levels printed again in running text on book p. 400: EXTERNAL CHECK PASSES.
(The alpha and beta columns have no second printing anywhere in the paper.)
Table III, with beta/alpha computed (the paper prints neither the ratio nor
any other derived column - see the sidecar on why nothing here checks itself):
pH alpha beta k* = beta/alpha, 1/h
6.0 2.20 0.55 0.250000
5.6 2.20 0.49 0.222727
5.4 2.20 0.32 0.145455
5.2 2.45 0.26 0.106122
4.8 3.00 0.14 0.046667
4.5 3.55 0.11 0.030986
beta strictly decreasing as pH falls: True - a factor of 5.0000 over the range
alpha non-decreasing as pH falls: True - a factor of 1.613636, and FLAT at 2.2 for the top 3 levels
k* strictly decreasing as pH falls: True - a factor of 8.068182
WHAT THAT MEANS PHYSICALLY: as the pH falls, the non-growth route to acid
is shut down five-fold while the growth-associated yield rises only 1.6 fold,
so the fermentation becomes almost purely growth-associated - at pH 4.5 the
two terms are equal only at k = 0.030986 1/h, 8.07x lower than at pH 6.0.
WHAT SIX PAIRS DO NOT ESTABLISH, and this page does not claim:
* NOT that the FORM holds at the other five pH levels. The form is tested by
the linearity of (1/N)(dP/dt) against k, which is Fig. 11, and only the
pH 6.0 run's points are printed. Six fitted pairs are six OUTPUTS of that
test, not the test.
* NOT a functional form for alpha(pH) or beta(pH). Six points, no replicates,
no stated uncertainty on any of them, and the paper itself only plots them
(Fig. 10) and reads an inflection off the plot.
* NOT that pH 5.4 is special. The paper says a change of behaviour occurs
there and locates an inflection of alpha(pH) at that pH from Fig. 10; with
three of the six alpha values printed as the SAME number, 2.2, nothing in
Table III alone can put an inflection anywhere.
THE pH 5.6 MARK, SETTLED BY ARITHMETIC AND NOT BY PIXELS:
beta strictly decreasing with the mark read as a DOT (0.49): True
beta strictly decreasing with the mark read as a MINUS (-0.49): False
-> the minus reading breaks the assertion this cell just executed, and the
break row below prices the violation on beta_monotone_margin. The paper's own
Fig. 10 (book p. 407) plots this column on a ZERO-BASED axis with all six
points above the axis, which says the same thing independently. The
connected-component measurement on the crop CORROBORATES a conclusion two
arithmetic checks already reach; it does not carry it alone.7. The pymrm models
Both reactor models are closed by the paper’s own \(k(t)\), and both are checked against the closed form rather than against data. Nothing in this paper tests either of them; they show that the Luedeking-Piret relation is a source term that transports, which is the form it has to be in for the “rational design of continuous fermentation processes” the Summary asks for.
# ------------------------------------------------------------- batch marcher
N_REF, P_REF = float(N_closed(T_HI)), float(P_closed(T_HI, ALPHA_PRINTED,
                                                     BETA_PRINTED))
MARCH_NT = [200, 400, 800, 1600]
MARCH = {nt: batch_march(nt, ALPHA_PRINTED, BETA_PRINTED) for nt in MARCH_NT}
MARCH_ERR = [float(abs(MARCH[nt][1]/P_REF - 1)) for nt in MARCH_NT]
MARCH_ORDERS = [float(np.log2(MARCH_ERR[i]/MARCH_ERR[i + 1]))
                for i in range(len(MARCH_ERR) - 1)]
MARCH_ORDER = MARCH_ORDERS[-1]
MARCH_FINEST = MARCH_ERR[-1]

# ---------------------------------------------------------------- plug flow
PFR_N = [200, 400, 800, 1600, 3200]
PFR = {n: PlugFlowFermenter(n, ALPHA_PRINTED, BETA_PRINTED).solve()
       for n in PFR_N}
PFR_OUT = {n: PFR[n].outlet() for n in PFR_N}
PFR_ERR = [float(abs(PFR_OUT[n][1]/P_REF - 1)) for n in PFR_N]
PFR_ORDERS = [float(np.log2(PFR_ERR[i]/PFR_ERR[i + 1]))
              for i in range(len(PFR_ERR) - 1)]
PFR_ORDER = PFR_ORDERS[-1]
# Richardson at first order on the two finest grids
PFR_P_RICH = float(2*PFR_OUT[3200][1] - PFR_OUT[1600][1])
PFR_P_RICH_REL = float(abs(PFR_P_RICH/P_REF - 1))
PFR_P_FINEST = float(PFR_OUT[3200][1])

# the last-cell read, for the comparison J4.2 made on its own physics
PFR_CENTRE_ERR = [float(abs(PFR[n].outlet_last_cell()[1]/P_REF - 1))
                  for n in PFR_N]
PFR_CENTRE_ORDERS = [float(np.log2(PFR_CENTRE_ERR[i]/PFR_CENTRE_ERR[i + 1]))
                     for i in range(len(PFR_CENTRE_ERR) - 1)]
PFR_CENTRE_ORDER = PFR_CENTRE_ORDERS[-1]
PFR_BOUNDARY_OVER_CENTRE = float(PFR_ERR[-1]/PFR_CENTRE_ERR[-1])
PFR_BOUNDARY_OVER_CENTRE_COARSE = float(PFR_ERR[0]/PFR_CENTRE_ERR[0])

print(f"closed-form reference at t = {T_HI} h:  N = {N_REF:.8f} U.O.D./ml,"
      f"  P = {P_REF:.8f} mg/ml\n")
print("pymrm BATCH, backward Euler + newton + NumJac((1,2)):")
for nt, e in zip(MARCH_NT, MARCH_ERR):
    print(f"  nt {nt:5d}   P {MARCH[nt][1]:12.8f}   rel err {e:.6e}")
print(f"  observed orders {['%.4f' % o for o in MARCH_ORDERS]}"
      f" -> {MARCH_ORDER:.4f}, first order as backward Euler must be")
print("\npymrm PLUG FLOW, construct_convflux_upwind + construct_div + newton:")
for n, e in zip(PFR_N, PFR_ERR):
    print(f"  ncell {n:5d}   P_out {PFR_OUT[n][1]:12.8f}   rel err {e:.6e}")
print(f"  observed orders {['%.4f' % o for o in PFR_ORDERS]}"
      f" -> {PFR_ORDER:.4f}, first order as donor-cell upwind must be")
print(f"  Richardson from the two finest grids: {PFR_P_RICH:.8f} mg/ml,"
      f" {PFR_P_RICH_REL:.3e} from the closed form")
print(f"\nBOUNDARY READ, MEASURED not assumed (the question J4.2 raised):")
print(f"  compute_boundary_values  order {PFR_ORDER:.4f} vs"
      f" {PFR_CENTRE_ORDER:.4f} for the last-cell read")
print(f"  error ratio, boundary read over last-cell read:"
      f" {PFR_BOUNDARY_OVER_CENTRE_COARSE:.6f} at ncell {PFR_N[0]},"
      f" {PFR_BOUNDARY_OVER_CENTRE:.6f} at ncell {PFR_N[-1]}")
print("  MEASURED, NOT ASSUMED, AND IT DOES NOT SAY WHAT THE STANDING ADVICE"
      " SAYS.\n  Both reads are FIRST order, and the last-cell read is the CLOSER"
      " of the two\n  at every grid, by a ratio that barely moves under"
      " refinement.  That is what a\n  zero-gradient outflow condition does, and"
      " it is the same conclusion J4.2\n  reached on different physics - so it is"
      " re-measured here, not inherited.\n  compute_boundary_values is kept"
      " because it returns the value the flux\n  operator actually transports, so"
      " a balance written on it closes:\n  CONSISTENCY, NOT ACCURACY.")
closed-form reference at t = 13.5 h: N = 9.68777169 U.O.D./ml, P = 45.32220609 mg/ml
pymrm BATCH, backward Euler + newton + NumJac((1,2)):
nt 200 P 47.83003730 rel err 5.533339e-02
nt 400 P 46.54777733 rel err 2.704130e-02
nt 800 P 45.92812486 rel err 1.336914e-02
nt 1600 P 45.62347523 rel err 6.647274e-03
observed orders ['1.0330', '1.0163', '1.0081'] -> 1.0081, first order as backward Euler must be
pymrm PLUG FLOW, construct_convflux_upwind + construct_div + newton:
ncell 200 P_out 48.14126932 rel err 6.220049e-02
ncell 400 P_out 46.69758745 rel err 3.034674e-02
ncell 800 P_out 46.00163487 rel err 1.499108e-02
ncell 1600 P_out 45.65988826 rel err 7.450700e-03
ncell 3200 P_out 45.49054320 rel err 3.714230e-03
observed orders ['1.0354', '1.0174', '1.0087', '1.0043'] -> 1.0043, first order as donor-cell upwind must be
Richardson from the two finest grids: 45.32119815 mg/ml, 2.224e-05 from the closed form
BOUNDARY READ, MEASURED not assumed (the question J4.2 raised):
compute_boundary_values order 1.0043 vs 1.0043 for the last-cell read
error ratio, boundary read over last-cell read: 1.016858 at ncell 200, 1.016655 at ncell 3200
MEASURED, NOT ASSUMED, AND IT DOES NOT SAY WHAT THE STANDING ADVICE SAYS.
Both reads are FIRST order, and the last-cell read is the CLOSER of the two
at every grid, by a ratio that barely moves under refinement. That is what a
zero-gradient outflow condition does, and it is the same conclusion J4.2
reached on different physics - so it is re-measured here, not inherited.
compute_boundary_values is kept because it returns the value the flux
operator actually transports, so a balance written on it closes:
CONSISTENCY, NOT ACCURACY.# ------------------------------------------------------------------ figures
fig, ax = plt.subplots(1, 3, figsize=(12.4, 3.9))
# (a) the fit, in the authors' own Fig. 11 variables
kg = np.linspace(0.0, max(K_OBS)*1.05, 200)
ax[0].plot(K_OBS, Y_OBS, "o", ms=5, color=C_BLUE, label="Table II, 22 rows")
ax[0].plot(kg, ALPHA_PRINTED*kg + BETA_PRINTED, "-", color=C_ORANGE, lw=2,
label=f"printed {ALPHA_PRINTED} k + {BETA_PRINTED}")
ax[0].plot(kg, ALPHA_A*kg + BETA_A, "--", color=C_GREEN, lw=2,
label=f"OLS {ALPHA_A:.3f} k + {BETA_A:.3f}")
ax[0].plot(kg, np.full_like(kg, Y_OBS.mean()), ":", color=C_GREY, lw=1.5,
label="null: constant")
ax[0].set_xlabel("$k$, 1/h")
ax[0].set_ylabel("$(1/N)\\,dP/dt$, mg/U.O.D. h")
ax[0].set_title("(a) eq. (3), the authors' Fig. 11 axes", fontsize=9.5)
ax[0].legend(fontsize=7.4, loc="upper left")
ax[0].set_xlim(0, None)
ax[0].set_ylim(0, None)
# (b) the integral test against the printed P column
tg = np.linspace(TP0, T_HI, 400)
ax[1].plot(TP, P_OBS, "o", ms=5, color=C_BLUE, label="Table II, printed $P$")
ax[1].plot(tg, P0_OBS + ALPHA_PRINTED*(NT2(tg) - NT2(TP0))
+ BETA_PRINTED*(NT2_INT(tg) - NT2_INT(TP0)), "-", color=C_ORANGE,
lw=2, label="eq. (2) integrated, printed pair")
ax[1].plot(tg, P0_OBS + A_ONLY_INT*(NT2(tg) - NT2(TP0)), ":", color=C_GREY,
lw=1.6, label="null: growth-associated only")
ax[1].plot(tg, P0_OBS + B_ONLY_INT*(NT2_INT(tg) - NT2_INT(TP0)), "-.",
color=C_PURPLE, lw=1.4, label="null: density only")
ax[1].axvline(T_CROSS_K, color=C_GREEN, lw=1, ls="--")
ax[1].set_xlabel("time, h")
ax[1].set_ylabel("$P$, mg/ml")
ax[1].set_title("(b) integral test; dashed line $k = k^*$", fontsize=9.5)
ax[1].legend(fontsize=7.4, loc="upper left")
# (c) the six printed pairs
ax[2].plot(T3S.pH, T3S.alpha_mg_lactic_per_UOD, "o-", color=C_BLUE,
label=r"$\alpha$, mg lactic/U.O.D.")
ax[2].plot(T3S.pH, T3S.beta_mg_lactic_per_UOD_h, "s-", color=C_ORANGE,
label=r"$\beta$, mg lactic/U.O.D./h")
ax[2].plot(T3S.pH, T3S.k_star_per_h, "^--", color=C_GREEN,
label=r"$k^*=\beta/\alpha$, 1/h")
ax[2].set_xlabel("pH")
ax[2].set_title("(c) Table III, all six levels", fontsize=9.5)
ax[2].legend(fontsize=7.6)
ax[2].invert_xaxis()
fig.tight_layout()
plt.show()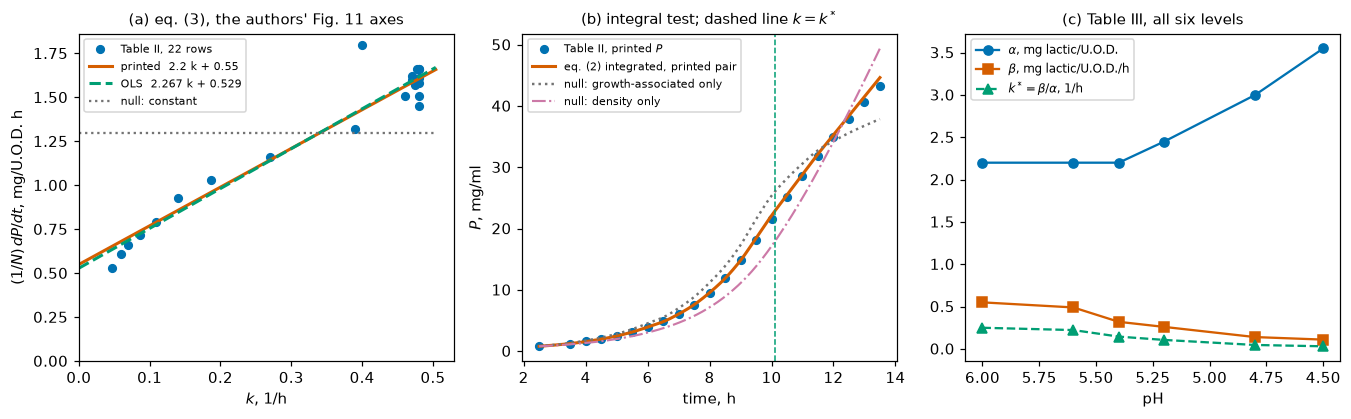
Validation
Ranked, and the top of the ranking is a refusal. The strongest validation available for a product-formation law would be a fermentation the constants were not fitted to. This paper prints exactly one fermentation’s raw data and that is the fermentation the pH 6·0 constants were fitted to, so that validation is not available and is not manufactured. What is below is what the printed numbers can actually support, in descending order of what it proves.
- Internal identities in Table II (transcription checks, proved by the paper’s own definitions on book p. 400) - and their teeth are measured, not claimed.
- A second, independent column path for every derived quantity - the crossover time is root-found on the \(k\) column and on the separate \(\mathrm{d}N/\mathrm{d}t\) and \(N\) columns.
- A third fitting route that touches no differentiated column - the integral form.
- Two solver discretisations against a closed form the model has exactly, both refined, both with observed orders.
- Two null baselines, each the paper’s own rejected alternative.
- NOT: agreement with any plotted curve. Figs. 4-11 are not digitised, so this page does not establish empirical adequacy against anything in this paper that lives only in a figure - including all five of the other pH levels, the shape of \(\alpha(\mathrm{pH})\) in Fig. 10, and the linearity of Fig. 11 at those five levels.
The one figure reading on this page, declared. Fig. 10’s lower panel was calibrated on its own gridlines and its six markers located, once, to confirm the sign of Table III’s pH 5·6 \(\beta\) cell - see The data. It ranks nowhere in the list above because it is not a validation: it settles a glyph. No value from it is in a CSV, in a fit, or in agreement.json, and the value 0·49 does not rest on it.
What this page cannot conclude
- That the Luedeking-Piret relation is correct. One run, and the constants were fitted on it. The refit tests the arithmetic of the authors’ fit, not the model.
- That the form holds across pH. That claim needs the five other runs’ raw data, which are not printed.
- Anything about \(\alpha(\mathrm{pH})\) or \(\beta(\mathrm{pH})\) as functions. Six points, no replicates, no stated uncertainties.
- That the plug-flow extension describes a real fermenter. No experiment in this paper is continuous.
# ================================================================== break table
# EVERY reported metric needs a row that moves it.  The rows are DEFECTS -
# things a careless transcription or a careless numerical choice would actually
# do - and the coverage map below is GENERATED from their measured moves, not
# written by hand.
MOVE_TOL = 1e-6


def _refit_all(t2=None, t1=None, t3=None, kinterp="pchip", quad="trapz",
               use_quotients=False, drop_first_P_row=False, k_min=None):
    """Recompute every table-derived metric from (possibly corrupted) inputs."""
    t2 = T2 if t2 is None else t2
    t1 = T1 if t1 is None else t1
    t3 = T3 if t3 is None else t3
    out = {}
    f3 = t2.dropna(subset=["k_per_h", "invN_dPdt_mg_per_UOD_h",
                           "N_UOD_per_ml", "dPdt_mg_per_ml_h"])
    if k_min is not None:                    # break row: fit the log phase only
        f3 = f3[f3.k_per_h >= k_min]
    k = f3.k_per_h.to_numpy()
    y = (f3.dPdt_mg_per_ml_h/f3.N_UOD_per_ml).to_numpy() if use_quotients \
        else f3.invN_dPdt_mg_per_UOD_h.to_numpy()
    X = np.column_stack([k, np.ones_like(k)])
    c = ols(X, y)
    r = y - X @ c
    s2 = (r**2).sum()/(len(k) - 2)
    cov = s2*np.linalg.inv(X.T @ X)
    out["alpha_refit_eq3"], out["beta_refit_eq3"] = float(c[0]), float(c[1])
    out["eq3_refit_rms"] = rms(r)
    out["eq3_R2"] = float(1 - (r**2).sum()/((y - y.mean())**2).sum())
    out["alpha_se_eq3"] = float(np.sqrt(cov[0, 0]))
    out["beta_se_eq3"] = float(np.sqrt(cov[1, 1]))
    out["alpha_beta_corr_eq3"] = float(cov[0, 1]/np.sqrt(cov[0, 0]*cov[1, 1]))
    r3 = t3.loc[t3.pH == 6.0].iloc[0]
    ap = float(r3.alpha_mg_lactic_per_UOD)
    bp = float(r3.beta_mg_lactic_per_UOD_h)
    out["alpha_refit_eq3_vs_printed"] = float(c[0]/ap - 1)
    out["beta_refit_eq3_vs_printed"] = float(c[1]/bp - 1)
    out["printed_alpha_in_se"] = float(abs(c[0] - ap)/np.sqrt(cov[0, 0]))
    out["printed_beta_in_se"] = float(abs(c[1] - bp)/np.sqrt(cov[1, 1]))
    out["beta_given_printed_alpha"] = float(np.mean(y - ap*k))
    out["alpha_given_printed_beta"] = float(np.sum(k*(y - bp))/np.sum(k*k))
    out["eq3_printed_pair_rms"] = rms(y - ap*k - bp)
    out["eq3_printed_pair_rms_penalty"] = float(rms(y - ap*k - bp)/rms(r) - 1)

    f2 = t2.dropna(subset=["N_UOD_per_ml", "dNdt_UOD_per_ml_h",
                           "dPdt_mg_per_ml_h"])
    if k_min is not None:
        f2 = f2[f2.k_per_h >= k_min]
    x2 = np.column_stack([f2.dNdt_UOD_per_ml_h.to_numpy(),
                          f2.N_UOD_per_ml.to_numpy()])
    dp = f2.dPdt_mg_per_ml_h.to_numpy()
    c2 = ols(x2, dp)
    out["alpha_refit_eq2"], out["beta_refit_eq2"] = float(c2[0]), float(c2[1])
    out["eq2_refit_rms"] = rms(dp - x2 @ c2)
    a1 = float(ols(x2[:, [0]], dp)[0])
    b1 = float(ols(x2[:, [1]], dp)[0])
    out["eq2_null_growth_only_rms"] = rms(dp - a1*x2[:, 0])
    out["eq2_null_density_only_rms"] = rms(dp - b1*x2[:, 1])
    out["eq2_null_growth_only_ratio"] = float(rms(dp - a1*x2[:, 0])
                                              / rms(dp - x2 @ c2))
    out["eq2_null_density_only_ratio"] = float(rms(dp - b1*x2[:, 1])
                                               / rms(dp - x2 @ c2))

    # THE PAPER'S OWN QUALIFIER, both halves.  Computed on the UNFILTERED table
    # so that the log-phase-only break row cannot empty one of the two windows.
    fsp = t2.dropna(subset=["N_UOD_per_ml", "dNdt_UOD_per_ml_h",
                            "dPdt_mg_per_ml_h", "k_per_h"])
    _, r_lg, ga_lg, gb_lg, _, _ = null_split(fsp, k_min=K_LOG)
    _, r_ot, ga_ot, gb_ot, _, _ = null_split(fsp, k_max=K_LOG)
    out["eq2_logphase_refit_rms"] = r_lg
    out["eq2_logphase_null_growth_only_ratio"] = ga_lg
    out["eq2_logphase_null_density_only_ratio"] = gb_lg
    out["eq2_outside_log_refit_rms"] = r_ot
    out["eq2_outside_log_null_growth_only_ratio"] = ga_ot
    out["eq2_outside_log_null_density_only_ratio"] = gb_ot

    nn = t2.dropna(subset=["N_UOD_per_ml"])
    if kinterp == "pchip":
        nt = PchipInterpolator(nn.time_h.to_numpy(), nn.N_UOD_per_ml.to_numpy())
        nti = nt.antiderivative()
    else:                                    # linear, break-row alternative
        _tg = np.linspace(nn.time_h.min(), nn.time_h.max(), 200001)
        _vg = np.interp(_tg, nn.time_h.to_numpy(), nn.N_UOD_per_ml.to_numpy())
        nt = PchipInterpolator(_tg, _vg)
        nti = nt.antiderivative()
    fp = t2.dropna(subset=["P_mg_per_ml"])
    fp = fp[fp.time_h <= t2.time_h.max() - 0.5]
    if drop_first_P_row:
        fp = fp.iloc[1:]
    tp = fp.time_h.to_numpy()
    po = fp.P_mg_per_ml.to_numpy()
    dn = nt(tp) - nt(tp[0])
    inn = nti(tp) - nti(tp[0])
    xc = np.column_stack([dn, inn])
    cc = ols(xc, po - po[0])
    out["alpha_refit_integral"], out["beta_refit_integral"] = (float(cc[0]),
                                                               float(cc[1]))
    out["integral_refit_rms"] = rms(po - po[0] - xc @ cc)
    ai = float(ols(xc[:, [0]], po - po[0])[0])
    bi = float(ols(xc[:, [1]], po - po[0])[0])
    out["integral_null_growth_only_ratio"] = float(
        rms(po - po[0] - ai*xc[:, 0])/rms(po - po[0] - xc @ cc))
    out["integral_null_density_only_ratio"] = float(
        rms(po - po[0] - bi*xc[:, 1])/rms(po - po[0] - xc @ cc))
    pred = po[0] + ap*dn + bp*inn
    m = tp > tp[0]
    out["P_curve_rms_rel"] = rms(pred[m]/po[m] - 1)
    out["P_curve_max_rel"] = float(np.abs(pred[m]/po[m] - 1).max())
    out["P_final_vs_printed"] = float(pred[-1]/po[-1] - 1)

    kk = t2.dropna(subset=["k_per_h"])
    if kinterp == "pchip":
        kt = PchipInterpolator(kk.time_h.to_numpy(), kk.k_per_h.to_numpy())
    else:
        _tg = np.linspace(kk.time_h.min(), kk.time_h.max(), 200001)
        kt = PchipInterpolator(_tg, np.interp(_tg, kk.time_h.to_numpy(),
                                              kk.k_per_h.to_numpy()))
    out["k_star_printed"] = float(bp/ap)
    out["crossover_time_h"] = float(brentq(lambda t: float(kt(t)) - bp/ap,
                                           9.0, 13.0, xtol=1e-13, rtol=1e-15))
    dd = t2.dropna(subset=["dNdt_UOD_per_ml_h", "N_UOD_per_ml"])
    dnt = PchipInterpolator(dd.time_h.to_numpy(), dd.dNdt_UOD_per_ml_h.to_numpy())
    nnt = PchipInterpolator(dd.time_h.to_numpy(), dd.N_UOD_per_ml.to_numpy())
    out["crossover_time_dNdt_route_h"] = float(brentq(
        lambda t: ap*float(dnt(t)) - bp*float(nnt(t)), 9.0, 13.0,
        xtol=1e-13, rtol=1e-15))
    tf2 = f2.time_h.to_numpy()
    if quad == "trapz":
        ga = ap*np.trapezoid(x2[:, 0], tf2)
        ng = bp*np.trapezoid(x2[:, 1], tf2)
        tot = np.trapezoid(dp, tf2)
    else:                                    # left rectangle, break-row
        w = np.diff(tf2)
        ga = ap*np.sum(x2[:-1, 0]*w)
        ng = bp*np.sum(x2[:-1, 1]*w)
        tot = np.sum(dp[:-1]*w)
    out["growth_assoc_share"] = float(ga/(ga + ng))
    out["integrated_closure_rel"] = float((ga + ng)/tot - 1)

    _kx = t2.dropna(subset=["k_per_h", "N_UOD_per_ml", "dNdt_UOD_per_ml_h"])
    out["k_identity_max_rel"] = float(np.abs(
        _kx.dNdt_UOD_per_ml_h/_kx.N_UOD_per_ml/_kx.k_per_h - 1).max())
    _qx = t2.dropna(subset=["invN_dPdt_mg_per_UOD_h", "N_UOD_per_ml",
                            "dPdt_mg_per_ml_h"])
    out["invN_identity_max_rel"] = float(np.abs(
        _qx.dPdt_mg_per_ml_h/_qx.N_UOD_per_ml/_qx.invN_dPdt_mg_per_UOD_h - 1).max())

    n1 = PchipInterpolator(t1.time_h.to_numpy(), t1.N_UOD_per_ml.to_numpy())
    ov = nn[(nn.time_h >= t1.time_h.min()) & (nn.time_h <= t1.time_h.max())]
    rr = np.abs(n1(ov.time_h.to_numpy())/ov.N_UOD_per_ml.to_numpy() - 1)
    out["table1_vs_table2_N_max_rel"] = float(rr.max())
    out["table1_vs_table2_N_rms_rel"] = rms(rr)

    s3 = t3.sort_values("pH", ascending=False)
    ks = (s3.beta_mg_lactic_per_UOD_h/s3.alpha_mg_lactic_per_UOD).to_numpy()
    out["beta_range_ph6_over_ph45"] = float(s3.beta_mg_lactic_per_UOD_h.iloc[0]
                                            / s3.beta_mg_lactic_per_UOD_h.iloc[-1])
    out["alpha_range_ph45_over_ph6"] = float(s3.alpha_mg_lactic_per_UOD.iloc[-1]
                                             / s3.alpha_mg_lactic_per_UOD.iloc[0])
    out["kstar_range_ph6_over_ph45"] = float(ks[0]/ks[-1])
    out["kstar_ph45_per_h"] = float(ks[-1])
    out["kstar_ph56_per_h"] = float(ks[1])
    # the smallest step by which beta falls as pH falls: the margin by which the
    # monotonicity the page reports actually holds.
    out["beta_monotone_margin"] = float(
        np.min(-np.diff(s3.beta_mg_lactic_per_UOD_h.to_numpy())))
    out["beta_sum_all_ph"] = float(s3.beta_mg_lactic_per_UOD_h.sum())
    return out


BASE = _refit_all()
METRICS = dict(BASE)
METRICS.update({
    "digit_substitution_detection": float(DIGIT_FRAC),
    "batch_marcher_order": MARCH_ORDER,
    "batch_marcher_finest_rel": MARCH_FINEST,
    "pfr_grid_order": PFR_ORDER,
    # the key NAMES ITS GRID, as J4.2 does: a plug-flow outlet is not a
    # grid-free quantity and a key that hides the grid invites one to be quoted.
    "pfr_outlet_P_ncell3200": PFR_P_FINEST,
    "pfr_richardson_vs_closed_form": PFR_P_RICH_REL,
    "pfr_boundary_over_last_cell": PFR_BOUNDARY_OVER_CENTRE,
    "closed_form_P_final": P_REF,
    "closed_form_N_final": N_REF,
})
# the two-route crossover residual is reported as its own metric
METRICS["crossover_two_routes_rel"] = float(
    abs(METRICS["crossover_time_h"]/METRICS["crossover_time_dNdt_route_h"] - 1))
print(f"{len(METRICS)} metrics.")
62 metrics.# ------------------------------------------------------------ the break rows
def _corrupt(df, mask_col, mask_val, col, new):
d = df.copy()
d.loc[d[mask_col] == mask_val, col] = new
return d
BREAK_FNS = [
("Table II: N at t = 9.50 h read 5.85 instead of 5.35 (a digit slip)",
lambda: _refit_all(t2=_corrupt(T2, "time_h", 9.50, "N_UOD_per_ml", 5.85))),
("Table II: dP/dt at t = 8.00 h read 4.87 instead of 4.37",
lambda: _refit_all(t2=_corrupt(T2, "time_h", 8.00, "dPdt_mg_per_ml_h", 4.87))),
# inside the logarithmic plateau, where dN/dt = k_c N makes the two
# regressors nearly proportional: the one place a single bad N cell can
# move a ratio that degeneracy otherwise pins near 1.
("Table II: N at t = 8.50 h read 3.96 instead of 3.46, inside the plateau",
lambda: _refit_all(t2=_corrupt(T2, "time_h", 8.50, "N_UOD_per_ml", 3.96))),
("Table II: k at t = 10.00 h read 0.276 instead of 0.270",
lambda: _refit_all(t2=_corrupt(T2, "time_h", 10.00, "k_per_h", 0.276))),
("Table II: P at t = 13.50 h read 48.3 instead of 43.3",
lambda: _refit_all(t2=_corrupt(T2, "time_h", 13.50, "P_mg_per_ml", 48.3))),
("Table II: the one-significant-figure t = 2.50 h row dropped",
lambda: _refit_all(t2=T2[T2.time_h != 2.50], drop_first_P_row=True)),
("Table I: N at t = 9.30 h read 4.04 instead of 4.94",
lambda: _refit_all(t1=_corrupt(T1, "time_h", 9.30, "N_UOD_per_ml", 4.04))),
("Table III: the pH 5.6 stray mark READ AS A MINUS SIGN, beta = -0.49",
lambda: _refit_all(t3=_corrupt(T3, "pH", 5.6, "beta_mg_lactic_per_UOD_h",
-0.49))),
("Table III: alpha at pH 6.0 read 2.7 instead of 2.2",
lambda: _refit_all(t3=_corrupt(T3, "pH", 6.0, "alpha_mg_lactic_per_UOD",
2.7))),
# The beta cell of the ONE row this whole page rests on was never corrupted
# by the original table. It is an ordinary single-digit transcription
# defect on the cell the page rests on, and that is the whole of its
# justification. The 5-for-3 is quoted as a KIND of mis-read this document
# demonstrably makes - this scan's text layer renders "pH 5.4" as "pH 3.4"
# on book p. 406 - NOT as the provenance of this particular substitution:
# the same rule licenses 0.53 and 0.33 just as readily, and the paper's own
# instance corrupts the digit BEFORE the mid-dot, which in 0.55 is the zero,
# so no instantiation is the exact analogue. What the alternatives would
# have moved is measured and printed below rather than argued.
("Table III: beta at pH 6.0 read 0.35 instead of 0.55, a 5-for-3 of the kind"
" this scan's own text layer makes on book p. 406",
lambda: _refit_all(t3=_corrupt(T3, "pH", 6.0, "beta_mg_lactic_per_UOD_h",
0.35))),
("Table III: mid-dot RELOCATED in alpha at pH 4.5, 3.55 read as 35.5",
lambda: _refit_all(t3=_corrupt(T3, "pH", 4.5, "alpha_mg_lactic_per_UOD",
35.5))),
("Table III: mid-dot DROPPED in beta at pH 4.5, 0.11 read as 1.1",
lambda: _refit_all(t3=_corrupt(T3, "pH", 4.5, "beta_mg_lactic_per_UOD_h",
1.1))),
("eq. (3) fitted on the LOGARITHMIC-GROWTH rows only (k >= 0.45), the window"
" where the paper says BOTH one-term assumptions are also valid",
lambda: _refit_all(k_min=0.45)),
("eq. (3) fitted on the UNROUNDED quotient dP/dt / N, not the printed column",
lambda: _refit_all(use_quotients=True)),
("linear interpolation of k(t) and N(t) instead of monotone cubic",
lambda: _refit_all(kinterp="linear")),
("left-rectangle instead of trapezoid for the integrated split",
lambda: _refit_all(quad="rect")),
]
BREAKS, COVERAGE = [], {}
for lbl, fn in BREAK_FNS:
got = fn()
BREAKS.append((lbl, got))
for k_, v in got.items():
if k_ not in METRICS:
continue
base = METRICS[k_]
denom = abs(base) if abs(base) > 1e-12 else 1.0
mv = abs(v - base)/denom
if mv > MOVE_TOL:
COVERAGE.setdefault(k_, []).append((lbl, float(mv)))
# --- numerical rows, which move the solver metrics ---------------------------
def _corrupt_k_closed_form(t_bad, k_bad):
"""closed-form N and P at t_end with ONE k cell mis-transcribed"""
kv = np.where(_kk.time_h.to_numpy() == t_bad, k_bad, _kk.k_per_h.to_numpy())
kt = PchipInterpolator(_kk.time_h.to_numpy(), kv)
ka = kt.antiderivative()
nf = lambda t: N_LO*np.exp(ka(t) - ka(T_LO))
g = np.linspace(T_LO, T_HI, 160001)
ni = PchipInterpolator(g, nf(g)).antiderivative()
return {"closed_form_N_final": float(nf(T_HI)),
"closed_form_P_final": float(P_LO + ALPHA_PRINTED*(nf(T_HI) - N_LO)
+ BETA_PRINTED*(ni(T_HI) - ni(T_LO)))}
def _corrupt_k_everywhere(t_bad, k_bad):
"""ONE mis-transcribed k cell, driving the SOLVE and the REFERENCE together.
`_corrupt_k_closed_form` above corrupts only the closed form, which is the
artificial half of the experiment: it decouples the two sides, and a metric
that is a RATIO of two reads of the same solve is untouched by it. Here the
same corrupted k(t) is handed to the plug-flow fermenter AND used to build
the closed form that scores it, so the solution is consistently wrong and
the ratio of the two outlet reads is re-formed on it. That is the only
honest way to test the claim this page used to make about that ratio - and
the claim did not survive it. The feed state is unchanged by construction:
N(T_LO) = N_LO and P(T_LO) = 0 whatever k does later.
"""
kv = np.where(_kk.time_h.to_numpy() == t_bad, k_bad, _kk.k_per_h.to_numpy())
kt = PchipInterpolator(_kk.time_h.to_numpy(), kv)
ka = kt.antiderivative()
nf = lambda t: N_LO*np.exp(ka(t) - ka(T_LO))
g = np.linspace(T_LO, T_HI, 160001)
ni = PchipInterpolator(g, nf(g)).antiderivative()
p_ref = float(P_LO + ALPHA_PRINTED*(nf(T_HI) - N_LO)
+ BETA_PRINTED*(ni(T_HI) - ni(T_LO)))
f = PlugFlowFermenter(PFR_N[-1], ALPHA_PRINTED, BETA_PRINTED, kt=kt).solve()
e_bv = abs(f.outlet()[1]/p_ref - 1)
e_lc = abs(f.outlet_last_cell()[1]/p_ref - 1)
return {"closed_form_N_final": float(nf(T_HI)),
"closed_form_P_final": p_ref,
"pfr_outlet_P_ncell3200": float(f.outlet()[1]),
"pfr_boundary_over_last_cell": float(e_bv/e_lc)}
def _self_convergence_order(vals):
"""The order you get by refining against your OWN finest grid.
A standard mistake where an exact reference exists: the finest value
carries its own O(h) error, which contaminates every difference and
inflates the apparent order. Here the closed form makes it measurable.
"""
ref = vals[-1]
errs = [abs(v/ref - 1.0) for v in vals[:-1]]
return float(np.log2(errs[-2]/errs[-1]))
PFR_ORDER_SELF = _self_convergence_order([PFR_OUT[n][1] for n in PFR_N])
MARCH_ORDER_SELF = _self_convergence_order([MARCH[nt][1] for nt in MARCH_NT])
NUM_ROWS = [
("batch marcher at nt = 200 instead of 1600",
{"batch_marcher_finest_rel": MARCH_ERR[0]}),
("plug flow at ncell = 200 instead of 3200",
{"pfr_outlet_P_ncell3200": float(PFR_OUT[200][1]),
"pfr_richardson_vs_closed_form": float(abs(
(2*PFR_OUT[400][1] - PFR_OUT[200][1])/P_REF - 1))}),
("plug-flow orders read off the two COARSEST grids instead of the two finest",
{"pfr_grid_order": PFR_ORDERS[0], "batch_marcher_order": MARCH_ORDERS[0]}),
("BOTH orders taken by SELF-CONVERGENCE against the finest grid instead of"
" against the closed form",
{"pfr_grid_order": PFR_ORDER_SELF, "batch_marcher_order": MARCH_ORDER_SELF}),
("outlet read off the last cell centre instead of compute_boundary_values",
{"pfr_boundary_over_last_cell": float(PFR_CENTRE_ERR[-1]/PFR_ERR[-1])}),
("closed form evaluated with the refitted pair instead of the printed one",
{"closed_form_P_final": float(P_closed(T_HI, ALPHA_A, BETA_A))}),
("Table II: k at t = 7.00 h read 0.98 instead of 0.48, in the closed form",
_corrupt_k_closed_form(7.00, 0.98)),
# THE ROW THAT BROKE THIS PAGE'S ONE DECLARED BLIND SPOT. t = 13.50 h is
# the LAST printed k cell, so on a plug-flow grid whose axial coordinate IS
# residence time it sits in the OUTLET cell; 0.047 read as 0.947 is a
# single-digit substitution in the first decimal place, the same class as
# the t = 7.00 row above (0.48 read as 0.98).
# A defect there changes the LOCAL GRADIENT at the outlet, which is exactly
# the quantity the boundary read and the last-cell read differ by.
("Table II: k at t = 13.50 h - the LAST k cell, so the OUTLET cell - read"
" 0.947 instead of 0.047, in the solve AND in the reference",
_corrupt_k_everywhere(13.50, 0.947)),
# the control for it: the SAME 0-for-9 substitution one printed row earlier,
# where the defect is no longer local to the outlet.
("Table II: the same 0-for-9 substitution ONE ROW EARLIER, k at t = 13.00 h"
" read 0.959 instead of 0.059, in the solve AND in the reference",
_corrupt_k_everywhere(13.00, 0.959)),
("N closed form from a LINEAR k(t) interpolant",
{"closed_form_N_final": float(
N_LO*np.exp(np.trapezoid(
np.interp(np.linspace(T_LO, T_HI, 200001),
_kk.time_h.to_numpy(), _kk.k_per_h.to_numpy()),
np.linspace(T_LO, T_HI, 200001))))}),
("digit-substitution detection scored at a 10x tighter tolerance",
{"digit_substitution_detection":
float(digit_detection(K_IDENT_MAX/10)[0]/DIGIT_TOTAL)}),
("crossover second route taken on the SAME k column as the first",
{"crossover_two_routes_rel": 0.0}),
]
for lbl, got in NUM_ROWS:
BREAKS.append((lbl, got))
for k_, v in got.items():
base = METRICS[k_]
denom = abs(base) if abs(base) > 1e-12 else 1.0
mv = abs(v - base)/denom
if mv > MOVE_TOL:
COVERAGE.setdefault(k_, []).append((lbl, float(mv)))
# NOTHING here is structural: every metric has a row that moves it. The
# crossover two-route residual is the closest thing to an identity on the page -
# the two column paths solve the same equation - but it is NOT zero, because the
# paths interpolate different printed cells, and a row that takes the second
# route on the first route's column collapses it. So it is covered, not
# excused.
STRUCTURAL = {}
uncovered = sorted(set(METRICS) - set(COVERAGE) - set(STRUCTURAL))
print(f"COVERAGE MAP, GENERATED FROM {len(BREAKS)} DEFECT INJECTIONS"
f" ({len(METRICS)} metrics, move threshold {MOVE_TOL:g} relative):")
for k_ in sorted(METRICS):
if k_ in COVERAGE:
rows = sorted(COVERAGE[k_], key=lambda r: -r[1])
print(f" {k_:38s} {len(rows)} row(s); strongest {rows[0][1]:.3e}"
f" <- {rows[0][0][:52]}")
elif k_ in STRUCTURAL:
print(f" {k_:38s} STRUCTURAL")
else:
print(f" {k_:38s} UNCOVERED")
assert not uncovered, f"metrics no break row moves and none named structural: {uncovered}"
_moving = {lbl for lbl, got in BREAKS
if any(k_ in COVERAGE and any(r[0] == lbl for r in COVERAGE[k_])
for k_ in got)}
N_BREAK_ROWS, N_MOVING_ROWS = len(BREAKS), len(_moving)
N_LINKS = sum(len(v) for v in COVERAGE.values())
assert N_MOVING_ROWS == N_BREAK_ROWS, (
f"a break row moves nothing: {sorted({l for l, _ in BREAKS} - _moving)}")
print(f"\n{N_MOVING_ROWS} of {N_BREAK_ROWS} rows move a reported metric;"
f" {N_LINKS} measured row-metric links.")
_cells = {lbl for lbl, _ in BREAKS
if lbl.startswith(("Table I:", "Table II:", "Table III:"))
and "row dropped" not in lbl}
N_CELL_ROWS = len(_cells)
N_METHOD_ROWS = N_BREAK_ROWS - N_CELL_ROWS
print(f" the rows split {N_CELL_ROWS} / {N_METHOD_ROWS} between"
f" MIS-TRANSCRIBING ONE PRINTED CELL and\n CHANGING A METHOD or a"
f" resolution, and that split is used below rather than asserted.")
# COVERED IS NOT THE SAME AS COVERED FAR ENOUGH TO MATTER. check_agreement.py
# compares at 5 %, so a metric whose strongest mover shifts it by less than that
# is one no defect on this page could surface as a CI regression. Rather than
# manufacture a bigger defect for each, the weak ones are NAMED, with what they
# are blind to, and the set is pinned so it cannot grow silently.
CI_REL_TOL = 0.05
WEAK = {k_: max(r[1] for r in v) for k_, v in COVERAGE.items()
if max(r[1] for r in v) <= CI_REL_TOL}
WEAKEST_COVER, WEAKEST_METRIC = min((max(r[1] for r in v), k_)
for k_, v in COVERAGE.items())
# WHAT KIND OF ROW IS A METRIC'S STRONGEST MOVER? Classified in code, because
# an earlier version of this page ASSERTED a mitigation - "each weak metric is
# still moved more than 5 % by a row that changes the method" - which its own
# definition of WEAK makes impossible: WEAK is the maximum over ALL rows. The
# retraction is printed below and the true statement is computed.
CELL_DEFECT_ROWS = {lbl for lbl, _ in BREAKS
if lbl.startswith(("Table I:", "Table II:", "Table III:"))
and "row dropped" not in lbl}
METHOD_ROWS = {lbl for lbl, _ in BREAKS} - CELL_DEFECT_ROWS
KIND = {lbl: ("one mis-transcribed cell" if lbl in CELL_DEFECT_ROWS
else "a change of METHOD") for lbl, _ in BREAKS}
STRONGEST = {k_: max(v, key=lambda r: r[1]) for k_, v in COVERAGE.items()}
# WHICH ROWS RESCUED WHICH METRIC - RECOMPUTED FROM THE COVERAGE MAP WITH THOSE
# ROWS TAKEN BACK OUT, never remembered. The sentence this block replaces
# carried a hand-written, WORD-SPELLED count - "three of those six" - that the
# page's own numbers contradict, and that the mechanical sweep below cannot see
# at any setting: its integer class is DIGIT strings of two or more digits. The
# review rows are located by matching the live table, so deleting one stops the
# notebook rather than silently changing a count.
ROW_BETA035 = next(l for l, _ in BREAKS if "beta at pH 6.0 read 0.35" in l)
ROW_SELFCONV = next(l for l, _ in BREAKS if l.startswith("BOTH orders"))
ROW_OUTLET_K = next(l for l, _ in BREAKS if "the LAST k cell" in l)
ROW_INLAND_K = next(l for l, _ in BREAKS if "ONE ROW EARLIER" in l)
REVIEW_WAVES = [("first review", {ROW_BETA035, ROW_SELFCONV}),
("second review", {ROW_OUTLET_K, ROW_INLAND_K})]
ALL_REVIEW_ROWS = set().union(*[r for _, r in REVIEW_WAVES])
def _weak_without(excluded):
"""the weak set this page WOULD declare with those rows out of the table."""
out = {}
for k_ in METRICS:
mv = max([m for lbl, m in COVERAGE.get(k_, []) if lbl not in excluded],
default=0.0)
if mv <= CI_REL_TOL:
out[k_] = mv
return out
def _weak_strongest(metric, excluded):
"""label of a metric's strongest mover with those rows out of the table."""
rows = [(m, lbl) for lbl, m in COVERAGE.get(metric, []) if lbl not in excluded]
return max(rows)[1] if rows else None
WEAK_BEFORE_REVIEW = _weak_without(ALL_REVIEW_ROWS)
WEAK_LADDER, _excl = [("before either review", WEAK_BEFORE_REVIEW)], set(ALL_REVIEW_ROWS)
for _name, _rows in REVIEW_WAVES:
_excl -= _rows
WEAK_LADDER.append((f"+ the {len(_rows)} rows of the {_name}",
_weak_without(_excl)))
assert WEAK_LADDER[-1][1].keys() == WEAK.keys(), "the ladder must end at WEAK"
N_WEAK_BEFORE = len(WEAK_BEFORE_REVIEW)
N_LEFT = N_WEAK_BEFORE - len(WEAK)
N_LEFT_FIRST_WAVE = N_WEAK_BEFORE - len(WEAK_LADDER[1][1])
N_LEFT_VIA_REVIEW = sum(1 for k_ in WEAK_BEFORE_REVIEW
if k_ not in WEAK and STRONGEST[k_][0] in ALL_REVIEW_ROWS)
assert N_LEFT == N_LEFT_VIA_REVIEW, (
"a metric left the blind spot on a row that was already in the table, which"
" is not what this block says")
_n, _is, _its = (len(WEAK), "is" if len(WEAK) == 1 else "are",
"its" if len(WEAK) == 1 else "their")
print(f"\nDECLARED BLIND SPOT: {_n} of the {len(METRICS)} metrics {_is} moved by"
f" {_its} strongest\nrow by LESS than CI's {CI_REL_TOL:.0%} comparison"
f" tolerance."
+ (f" THE SET IS EMPTY: every metric on this page is moved\npast"
f" {CI_REL_TOL:.0%} by at least one row, and the WEAKEST COVER ON THE"
f" PAGE is {WEAKEST_COVER:.4%},\non {WEAKEST_METRIC} - the one metric"
" that WAS weak, until the row that breaks\nit, described below, went"
" into the table above."
if not WEAK else
" A defect of the size injected here would not\nsurface as a regression"
" on them. Named, not rounded away, with the row that\nmoves each most"
" and what kind of row that is:"))
for k_ in sorted(WEAK, key=lambda x: WEAK[x]):
lbl, mv = STRONGEST[k_]
print(f" {k_:32s} {mv:8.4%} <- {KIND[lbl]}:\n {'':32s} "
f" {lbl[:78]}")
print(f"\nWHAT THAT MEANS, AND WHAT IT DOES NOT - computed, not asserted:")
print(f" * an earlier version of this page listed {N_WEAK_BEFORE} weak metrics"
f" and said each was \"moved by\n more than {CI_REL_TOL:.0%} by a row"
f" that changes the method\". That is false by\n construction - WEAK is"
f" the MAXIMUM move over ALL rows - and it is RETRACTED.\n Nothing in the"
f" table those {N_WEAK_BEFORE} were measured against moved any of them"
f" past\n {max(WEAK_BEFORE_REVIEW.values()):.4%}, and"
f" {sum(1 for k_ in WEAK_BEFORE_REVIEW if _weak_strongest(k_, ALL_REVIEW_ROWS) in METHOD_ROWS)}"
f" of the {N_WEAK_BEFORE} already had a METHOD-changing row as\n their"
f" strongest mover, so the mitigation inverted the causal story as well as"
f"\n the arithmetic.")
print(f" * THE BLIND SPOT AS THE REVIEW ROWS WENT IN, each line recomputed with"
f" the later\n rows REMOVED from the coverage map:")
for _name, _w in WEAK_LADDER:
print(f" {_name:34s} {len(_w):2d} weak of {len(METRICS)}")
print(f" So {N_LEFT_FIRST_WAVE} of the {N_WEAK_BEFORE} left on the first"
f" review's two rows and {N_LEFT - N_LEFT_FIRST_WAVE} on the second's,"
f"\n {N_LEFT} in all - and for ALL {N_LEFT_VIA_REVIEW} of them the"
f" strongest mover IS one of those rows.\n NOT ONE left on a row that"
f" was already in the table. A previous version of this\n block said"
f" \"three of those six\": wrong on both halves, and word-spelled, so no"
f"\n sweep on this page could have caught it.")
for k_ in sorted(WEAK_BEFORE_REVIEW, key=lambda x: -WEAK_BEFORE_REVIEW[x]):
lbl, mv = STRONGEST[k_]
print(f" {k_:34s} {WEAK_BEFORE_REVIEW[k_]:8.4%} ->{mv:9.4%}"
f" {'a review row' if lbl in ALL_REVIEW_ROWS else 'an old row'}")
print(f" * {len(METRICS) - len(WEAK)} of the {len(METRICS)} metrics ARE moved"
f" past {CI_REL_TOL:.0%} by something on this page,\n so CI can see a"
f" regression in them.")
_ratio_rows = dict(COVERAGE["pfr_boundary_over_last_cell"])
_ratio_out, _ratio_in = _ratio_rows[ROW_OUTLET_K], _ratio_rows[ROW_INLAND_K]
_ratio_swap = max(m for l, m in _ratio_rows.items()
if l not in (ROW_OUTLET_K, ROW_INLAND_K))
print(f" * WHY THE SURVIVOR DID NOT SURVIVE: pfr_boundary_over_last_cell is a"
f" RATIO of two\n reads of the SAME solve, and they agree to about"
f" {(PFR_BOUNDARY_OVER_CENTRE - 1):.2%} on every grid -"
f" {' '.join('%.6f' % (PFR_ERR[i]/PFR_CENTRE_ERR[i]) for i in range(len(PFR_N)))}"
f"\n over a 16x refinement. This page used to say that ANY defect"
f" changing the\n solution moves BOTH reads and leaves the ratio where it"
f" was, so that only\n swapping which read is on top could move it."
f" THAT IS FALSE AS A UNIVERSAL AND\n THE COUNTEREXAMPLE IS NOW A ROW."
f" What is true is narrower: a defect acting AWAY\n from the outlet does"
f" move both reads together. The SAME single-digit\n substitution one"
f" printed row earlier moves the ratio {_ratio_in:.4%}, and the only\n "
f" other row that moves it at all is the read swap itself, at"
f" {_ratio_swap:.4%}.\n But k at t = {T_HI:.2f} h is the LAST printed k"
f" cell, so it sits in the OUTLET cell,\n and a defect there changes the"
f" local gradient - the one quantity the two reads\n differ by. It moves"
f" the ratio {_ratio_out:.4%}, past CI's {CI_REL_TOL:.0%}. The ratio was"
f" never\n structurally protected; it was protected by WHERE this page"
f" happened to inject.")
# WHAT THE PROVENANCE STORY IS WORTH, PRICED RATHER THAN ARGUED. The beta row
# quotes a 5-for-3 as a KIND of mis-read this scan demonstrably makes, not as
# the provenance of this particular substitution, because the same rule licenses
# the OTHER 5 in 0.55 just as readily - and that choice is not free: under the
# other instantiation the two crossover metrics would have stayed weak.
_beta_alts = [(b, _refit_all(t3=_corrupt(T3, "pH", 6.0,
"beta_mg_lactic_per_UOD_h", b)))
for b in (0.53, 0.35, 0.33)]
_alt_metrics = ("crossover_time_h", "crossover_time_dNdt_route_h",
"alpha_given_printed_beta")
print(f"\nTHE beta ROW IS ONE INSTANTIATION OF ITS RULE, NOT THE ONLY ONE AND"
f" NOT THE LARGEST.\nThe rule licenses the same 5-for-3 on either 5 of the"
f" printed 0.55, or on both:")
for _b, _g in _beta_alts:
print(" 0.55 -> %.2f " % _b + " ".join(
f" {k_}: {abs(_g[k_] - METRICS[k_])/abs(METRICS[k_]):8.4%}"
for k_ in _alt_metrics))
print(f" The injected row is the MIDDLE one, which is the opposite of tuning,"
f" but the escape\n of the two crossover metrics from the blind spot does"
f" depend on the choice. So the\n row rests on being a single-digit"
f" transcription defect on the ONE Table III cell\n this page rests on;"
f" the text-layer story is quoted as a KIND of mis-read this\n document"
f" makes, and the paper's own instance (pH 5.4 read as 3.4, book p. 406)"
f"\n corrupts the digit BEFORE the mid-dot, which in 0.55 is the zero - so"
f" no\n instantiation is its exact analogue.")
WEAK_PINNED = set()
assert set(WEAK) <= WEAK_PINNED, (
f"a metric has become weakly covered without being named: {set(WEAK) - WEAK_PINNED}")
print(f"\nweakest cover on the page: {WEAKEST_COVER:.4%} on {WEAKEST_METRIC}")
ABS_FLOOR = 1e-12
BELOW_FLOOR_COMPANION = {"crossover_two_routes_rel": "crossover_time_h"}
below = {k_: v for k_, v in METRICS.items() if abs(v) < ABS_FLOOR}
assert not (set(below) - set(BELOW_FLOOR_COMPANION)), (
f"metrics below ABS_FLOOR with no companion named:"
f" {set(below) - set(BELOW_FLOOR_COMPANION)}")
N_BELOW_FLOOR = len(below)
print(f"\nbelow CI's ABS_FLOOR = {ABS_FLOOR:g}: {N_BELOW_FLOOR} metric(s)."
f" Named with an above-floor companion:")
for k_, comp in BELOW_FLOOR_COMPANION.items():
print(f" {'BELOW' if k_ in below else 'above'} {k_:34s} = {METRICS[k_]:.3e}"
f" companion {comp} = {METRICS[comp]:.6g}")
SECOND_ROUTES = {
"alpha, eq.(3) OLS vs the integral form (no differentiated column)":
float(abs(ALPHA_A/ALPHA_C - 1)),
"beta, eq.(3) OLS vs the integral form": float(abs(BETA_A/BETA_C - 1)),
"alpha, eq.(3) OLS vs eq.(2) OLS (N^2 weighting)":
float(abs(ALPHA_A/ALPHA_B - 1)),
"crossover time, k column vs dN/dt and N columns":
METRICS["crossover_two_routes_rel"],
"batch P(t_end), pymrm marcher vs closed form": MARCH_FINEST,
"plug-flow P_out, Richardson vs closed form": PFR_P_RICH_REL,
}
print(f"\n{len(SECOND_ROUTES)} quantities computed a second way:")
for k_, v in SECOND_ROUTES.items():
print(f" {v:.3e} {k_}")
print()
report_agreement(PAGE, METRICS)COVERAGE MAP, GENERATED FROM 28 DEFECT INJECTIONS (62 metrics, move threshold 1e-06 relative):
P_curve_max_rel 7 row(s); strongest 3.399e+00 <- Table III: beta at pH 6.0 read 0.35 instead of 0.55,
P_curve_rms_rel 7 row(s); strongest 6.433e+00 <- Table III: beta at pH 6.0 read 0.35 instead of 0.55,
P_final_vs_printed 7 row(s); strongest 6.373e+00 <- Table III: beta at pH 6.0 read 0.35 instead of 0.55,
alpha_beta_corr_eq3 3 row(s); strongest 1.211e-01 <- eq. (3) fitted on the LOGARITHMIC-GROWTH rows only (
alpha_given_printed_beta 5 row(s); strongest 2.114e-01 <- Table III: beta at pH 6.0 read 0.35 instead of 0.55,
alpha_range_ph45_over_ph6 2 row(s); strongest 9.000e+00 <- Table III: mid-dot RELOCATED in alpha at pH 4.5, 3.5
alpha_refit_eq2 5 row(s); strongest 2.950e-01 <- eq. (3) fitted on the LOGARITHMIC-GROWTH rows only (
alpha_refit_eq3 4 row(s); strongest 8.873e-02 <- eq. (3) fitted on the LOGARITHMIC-GROWTH rows only (
alpha_refit_eq3_vs_printed 5 row(s); strongest 6.306e+00 <- Table III: alpha at pH 6.0 read 2.7 instead of 2.2
alpha_refit_integral 5 row(s); strongest 1.768e-01 <- Table II: P at t = 13.50 h read 48.3 instead of 43.3
alpha_se_eq3 4 row(s); strongest 2.412e+01 <- eq. (3) fitted on the LOGARITHMIC-GROWTH rows only (
batch_marcher_finest_rel 1 row(s); strongest 7.324e+00 <- batch marcher at nt = 200 instead of 1600
batch_marcher_order 2 row(s); strongest 5.884e-01 <- BOTH orders taken by SELF-CONVERGENCE against the fi
beta_given_printed_alpha 5 row(s); strongest 3.079e-01 <- Table III: alpha at pH 6.0 read 2.7 instead of 2.2
beta_monotone_margin 3 row(s); strongest 3.300e+01 <- Table III: mid-dot DROPPED in beta at pH 4.5, 0.11 r
beta_range_ph6_over_ph45 2 row(s); strongest 9.000e-01 <- Table III: mid-dot DROPPED in beta at pH 4.5, 0.11 r
beta_refit_eq2 5 row(s); strongest 5.545e-01 <- eq. (3) fitted on the LOGARITHMIC-GROWTH rows only (
beta_refit_eq3 4 row(s); strongest 1.371e-01 <- eq. (3) fitted on the LOGARITHMIC-GROWTH rows only (
beta_refit_eq3_vs_printed 5 row(s); strongest 1.417e+01 <- Table III: beta at pH 6.0 read 0.35 instead of 0.55,
beta_refit_integral 5 row(s); strongest 2.726e-01 <- Table II: P at t = 13.50 h read 48.3 instead of 43.3
beta_se_eq3 4 row(s); strongest 3.042e+01 <- eq. (3) fitted on the LOGARITHMIC-GROWTH rows only (
beta_sum_all_ph 3 row(s); strongest 5.294e-01 <- Table III: mid-dot DROPPED in beta at pH 4.5, 0.11 r
closed_form_N_final 4 row(s); strongest 6.905e-01 <- Table II: the same 0-for-9 substitution ONE ROW EARL
closed_form_P_final 4 row(s); strongest 3.588e-01 <- Table II: the same 0-for-9 substitution ONE ROW EARL
crossover_time_dNdt_route_h 3 row(s); strongest 6.472e-02 <- Table III: beta at pH 6.0 read 0.35 instead of 0.55,
crossover_time_h 4 row(s); strongest 6.530e-02 <- Table III: beta at pH 6.0 read 0.35 instead of 0.55,
crossover_two_routes_rel 1 row(s); strongest 1.000e+00 <- crossover second route taken on the SAME k column as
digit_substitution_detection 1 row(s); strongest 1.281e-01 <- digit-substitution detection scored at a 10x tighter
eq2_logphase_null_density_only_ratio 2 row(s); strongest 8.388e-01 <- Table II: N at t = 8.50 h read 3.96 instead of 3.46,
eq2_logphase_null_growth_only_ratio 2 row(s); strongest 3.241e-01 <- Table II: N at t = 8.50 h read 3.96 instead of 3.46,
eq2_logphase_refit_rms 2 row(s); strongest 6.195e-01 <- Table II: dP/dt at t = 8.00 h read 4.87 instead of 4
eq2_null_density_only_ratio 5 row(s); strongest 7.898e-01 <- eq. (3) fitted on the LOGARITHMIC-GROWTH rows only (
eq2_null_density_only_rms 5 row(s); strongest 9.335e-01 <- eq. (3) fitted on the LOGARITHMIC-GROWTH rows only (
eq2_null_growth_only_ratio 5 row(s); strongest 8.133e-01 <- eq. (3) fitted on the LOGARITHMIC-GROWTH rows only (
eq2_null_growth_only_rms 3 row(s); strongest 9.410e-01 <- eq. (3) fitted on the LOGARITHMIC-GROWTH rows only (
eq2_outside_log_null_density_only_ratio 2 row(s); strongest 1.187e-01 <- Table II: N at t = 9.50 h read 5.85 instead of 5.35
eq2_outside_log_null_growth_only_ratio 2 row(s); strongest 8.332e-02 <- Table II: N at t = 9.50 h read 5.85 instead of 5.35
eq2_outside_log_refit_rms 2 row(s); strongest 9.089e-02 <- Table II: N at t = 9.50 h read 5.85 instead of 5.35
eq2_refit_rms 5 row(s); strongest 6.837e-01 <- eq. (3) fitted on the LOGARITHMIC-GROWTH rows only (
eq3_R2 4 row(s); strongest 9.595e-01 <- eq. (3) fitted on the LOGARITHMIC-GROWTH rows only (
eq3_printed_pair_rms 6 row(s); strongest 1.222e+00 <- Table III: beta at pH 6.0 read 0.35 instead of 0.55,
eq3_printed_pair_rms_penalty 6 row(s); strongest 1.886e+02 <- Table III: beta at pH 6.0 read 0.35 instead of 0.55,
eq3_refit_rms 4 row(s); strongest 3.801e-01 <- eq. (3) fitted on the LOGARITHMIC-GROWTH rows only (
growth_assoc_share 7 row(s); strongest 4.036e-01 <- eq. (3) fitted on the LOGARITHMIC-GROWTH rows only (
integral_null_density_only_ratio 5 row(s); strongest 8.129e-01 <- Table II: P at t = 13.50 h read 48.3 instead of 43.3
integral_null_growth_only_ratio 5 row(s); strongest 7.156e-01 <- Table II: P at t = 13.50 h read 48.3 instead of 43.3
integral_refit_rms 5 row(s); strongest 3.607e+00 <- Table II: P at t = 13.50 h read 48.3 instead of 43.3
integrated_closure_rel 8 row(s); strongest 1.142e+01 <- Table III: beta at pH 6.0 read 0.35 instead of 0.55,
invN_identity_max_rel 3 row(s); strongest 6.072e+00 <- Table II: N at t = 8.50 h read 3.96 instead of 3.46,
k_identity_max_rel 2 row(s); strongest 3.541e+00 <- Table II: N at t = 8.50 h read 3.96 instead of 3.46,
k_star_printed 2 row(s); strongest 3.636e-01 <- Table III: beta at pH 6.0 read 0.35 instead of 0.55,
kstar_ph45_per_h 2 row(s); strongest 9.000e+00 <- Table III: mid-dot DROPPED in beta at pH 4.5, 0.11 r
kstar_ph56_per_h 1 row(s); strongest 2.000e+00 <- Table III: the pH 5.6 stray mark READ AS A MINUS SIG
kstar_range_ph6_over_ph45 4 row(s); strongest 9.000e+00 <- Table III: mid-dot RELOCATED in alpha at pH 4.5, 3.5
pfr_boundary_over_last_cell 3 row(s); strongest 5.621e-02 <- Table II: k at t = 13.50 h - the LAST k cell, so the
pfr_grid_order 2 row(s); strongest 5.868e-01 <- BOTH orders taken by SELF-CONVERGENCE against the fi
pfr_outlet_P_ncell3200 3 row(s); strongest 3.597e-01 <- Table II: the same 0-for-9 substitution ONE ROW EARL
pfr_richardson_vs_closed_form 1 row(s); strongest 6.676e+01 <- plug flow at ncell = 200 instead of 3200
printed_alpha_in_se 5 row(s); strongest 5.512e+00 <- Table III: alpha at pH 6.0 read 2.7 instead of 2.2
printed_beta_in_se 5 row(s); strongest 7.383e+00 <- Table III: beta at pH 6.0 read 0.35 instead of 0.55,
table1_vs_table2_N_max_rel 3 row(s); strongest 2.520e+00 <- Table II: N at t = 8.50 h read 3.96 instead of 3.46,
table1_vs_table2_N_rms_rel 4 row(s); strongest 1.113e+00 <- Table II: N at t = 8.50 h read 3.96 instead of 3.46,
28 of 28 rows move a reported metric; 235 measured row-metric links.
the rows split 14 / 14 between MIS-TRANSCRIBING ONE PRINTED CELL and
CHANGING A METHOD or a resolution, and that split is used below rather than asserted.
DECLARED BLIND SPOT: 0 of the 62 metrics are moved by their strongest
row by LESS than CI's 5% comparison tolerance. THE SET IS EMPTY: every metric on this page is moved
past 5% by at least one row, and the WEAKEST COVER ON THE PAGE is 5.6207%,
on pfr_boundary_over_last_cell - the one metric that WAS weak, until the row that breaks
it, described below, went into the table above.
WHAT THAT MEANS, AND WHAT IT DOES NOT - computed, not asserted:
* an earlier version of this page listed 6 weak metrics and said each was "moved by
more than 5% by a row that changes the method". That is false by
construction - WEAK is the MAXIMUM move over ALL rows - and it is RETRACTED.
Nothing in the table those 6 were measured against moved any of them past
3.2496%, and 4 of the 6 already had a METHOD-changing row as
their strongest mover, so the mitigation inverted the causal story as well as
the arithmetic.
* THE BLIND SPOT AS THE REVIEW ROWS WENT IN, each line recomputed with the later
rows REMOVED from the coverage map:
before either review 6 weak of 62
+ the 2 rows of the first review 1 weak of 62
+ the 2 rows of the second review 0 weak of 62
So 5 of the 6 left on the first review's two rows and 1 on the second's,
6 in all - and for ALL 6 of them the strongest mover IS one of those rows.
NOT ONE left on a row that was already in the table. A previous version of this
block said "three of those six": wrong on both halves, and word-spelled, so no
sweep on this page could have caught it.
pfr_boundary_over_last_cell 3.2496% -> 5.6207% a review row
pfr_grid_order 3.0938% -> 58.6773% a review row
crossover_time_h 2.6391% -> 6.5301% a review row
crossover_time_dNdt_route_h 2.6292% -> 6.4717% a review row
batch_marcher_order 2.4715% -> 58.8393% a review row
alpha_given_printed_beta 2.1657% -> 21.1414% a review row
* 62 of the 62 metrics ARE moved past 5% by something on this page,
so CI can see a regression in them.
* WHY THE SURVIVOR DID NOT SURVIVE: pfr_boundary_over_last_cell is a RATIO of two
reads of the SAME solve, and they agree to about 1.67% on every grid - 1.016858 1.016749 1.016695 1.016668 1.016655
over a 16x refinement. This page used to say that ANY defect changing the
solution moves BOTH reads and leaves the ratio where it was, so that only
swapping which read is on top could move it. THAT IS FALSE AS A UNIVERSAL AND
THE COUNTEREXAMPLE IS NOW A ROW. What is true is narrower: a defect acting AWAY
from the outlet does move both reads together. The SAME single-digit
substitution one printed row earlier moves the ratio 0.1466%, and the only
other row that moves it at all is the read swap itself, at 3.2496%.
But k at t = 13.50 h is the LAST printed k cell, so it sits in the OUTLET cell,
and a defect there changes the local gradient - the one quantity the two reads
differ by. It moves the ratio 5.6207%, past CI's 5%. The ratio was never
structurally protected; it was protected by WHERE this page happened to inject.
THE beta ROW IS ONE INSTANTIATION OF ITS RULE, NOT THE ONLY ONE AND NOT THE LARGEST.
The rule licenses the same 5-for-3 on either 5 of the printed 0.55, or on both:
0.55 -> 0.53 crossover_time_h: 0.4769% crossover_time_dNdt_route_h: 0.4783% alpha_given_printed_beta: 2.1141%
0.55 -> 0.35 crossover_time_h: 6.5301% crossover_time_dNdt_route_h: 6.4717% alpha_given_printed_beta: 21.1414%
0.55 -> 0.33 crossover_time_h: 7.5964% crossover_time_dNdt_route_h: 7.5258% alpha_given_printed_beta: 23.2556%
The injected row is the MIDDLE one, which is the opposite of tuning, but the escape
of the two crossover metrics from the blind spot does depend on the choice. So the
row rests on being a single-digit transcription defect on the ONE Table III cell
this page rests on; the text-layer story is quoted as a KIND of mis-read this
document makes, and the paper's own instance (pH 5.4 read as 3.4, book p. 406)
corrupts the digit BEFORE the mid-dot, which in 0.55 is the zero - so no
instantiation is its exact analogue.
weakest cover on the page: 5.6207% on pfr_boundary_over_last_cell
below CI's ABS_FLOOR = 1e-12: 0 metric(s). Named with an above-floor companion:
above crossover_two_routes_rel = 2.450e-05 companion crossover_time_h = 10.1027
6 quantities computed a second way:
2.683e-03 alpha, eq.(3) OLS vs the integral form (no differentiated column)
3.633e-02 beta, eq.(3) OLS vs the integral form
1.020e-02 alpha, eq.(3) OLS vs eq.(2) OLS (N^2 weighting)
2.450e-05 crossover time, k column vs dN/dt and N columns
6.647e-03 batch P(t_end), pymrm marcher vs closed form
2.224e-05 plug-flow P_out, Richardson vs closed form
Agreement metrics for J4.4-luedeking-piret:
alpha_refit_eq3 = 2.2666
beta_refit_eq3 = 0.52868
eq3_refit_rms = 0.10079
eq3_R2 = 0.93744
alpha_se_eq3 = 0.13093
beta_se_eq3 = 0.049837
alpha_beta_corr_eq3 = -0.8919
alpha_refit_eq3_vs_printed = 0.030256
beta_refit_eq3_vs_printed = -0.038757
printed_alpha_in_se = 0.50839
printed_beta_in_se = 0.42771
beta_given_printed_alpha = 0.55128
alpha_given_printed_beta = 2.2166
eq3_printed_pair_rms = 0.10145
eq3_printed_pair_rms_penalty = 0.0065211
alpha_refit_eq2 = 2.2899
beta_refit_eq2 = 0.51012
eq2_refit_rms = 0.323
eq2_null_growth_only_rms = 1.7927
eq2_null_density_only_rms = 1.5878
eq2_null_growth_only_ratio = 5.55
eq2_null_density_only_ratio = 4.9158
eq2_logphase_refit_rms = 0.10216
eq2_logphase_null_growth_only_ratio = 1.036
eq2_logphase_null_density_only_ratio = 1.0332
eq2_outside_log_refit_rms = 0.44743
eq2_outside_log_null_growth_only_ratio = 5.0119
eq2_outside_log_null_density_only_ratio = 3.7082
alpha_refit_integral = 2.2727
beta_refit_integral = 0.51015
integral_refit_rms = 0.15377
integral_null_growth_only_ratio = 14.242
integral_null_density_only_ratio = 17.794
P_curve_rms_rel = 0.016979
P_curve_max_rel = 0.038359
P_final_vs_printed = 0.031167
k_star_printed = 0.25
crossover_time_h = 10.103
crossover_time_dNdt_route_h = 10.103
growth_assoc_share = 0.46693
integrated_closure_rel = 0.017273
k_identity_max_rel = 0.027356
invN_identity_max_rel = 0.01841
table1_vs_table2_N_max_rel = 0.033774
table1_vs_table2_N_rms_rel = 0.012495
beta_range_ph6_over_ph45 = 5
alpha_range_ph45_over_ph6 = 1.6136
kstar_range_ph6_over_ph45 = 8.0682
kstar_ph45_per_h = 0.030986
kstar_ph56_per_h = 0.22273
beta_monotone_margin = 0.03
beta_sum_all_ph = 1.87
digit_substitution_detection = 0.8737
batch_marcher_order = 1.0081
batch_marcher_finest_rel = 0.0066473
pfr_grid_order = 1.0043
pfr_outlet_P_ncell3200 = 45.491
pfr_richardson_vs_closed_form = 2.224e-05
pfr_boundary_over_last_cell = 1.0167
closed_form_P_final = 45.322
closed_form_N_final = 9.6878
crossover_two_routes_rel = 2.4504e-05{'page': 'J4.4-luedeking-piret',
'metrics': {'alpha_refit_eq3': 2.266562459014257,
'beta_refit_eq3': 0.5286838633464783,
'eq3_refit_rms': 0.10079229645369017,
'eq3_R2': 0.9374392698851622,
'alpha_se_eq3': 0.13092784705466373,
'beta_se_eq3': 0.04983730744626089,
'alpha_beta_corr_eq3': -0.8919021984281227,
'alpha_refit_eq3_vs_printed': 0.03025566318829842,
'beta_refit_eq3_vs_printed': -0.03875661209731218,
'printed_alpha_in_se': 0.5083903883828939,
'printed_beta_in_se': 0.4277144522004267,
'beta_given_printed_alpha': 0.5512818181818182,
'alpha_given_printed_beta': 2.2166161745924633,
'eq3_printed_pair_rms': 0.10144957547292331,
'eq3_printed_pair_rms_penalty': 0.006521123561612052,
'alpha_refit_eq2': 2.289913060249211,
'beta_refit_eq2': 0.5101174086190821,
'eq2_refit_rms': 0.32300377894286736,
'eq2_null_growth_only_rms': 1.7926614601592492,
'eq2_null_density_only_rms': 1.5878141525349339,
'eq2_null_growth_only_ratio': 5.549970548413719,
'eq2_null_density_only_ratio': 4.9157757773966635,
'eq2_logphase_refit_rms': 0.10215501374994357,
'eq2_logphase_null_growth_only_ratio': 1.036042034585876,
'eq2_logphase_null_density_only_ratio': 1.0331965393532425,
'eq2_outside_log_refit_rms': 0.4474255232549434,
'eq2_outside_log_null_growth_only_ratio': 5.011873183256333,
'eq2_outside_log_null_density_only_ratio': 3.708246438382261,
'alpha_refit_integral': 2.2726599980629043,
'beta_refit_integral': 0.5101496820785338,
'integral_refit_rms': 0.15376889558359727,
'integral_null_growth_only_ratio': 14.24162832213242,
'integral_null_density_only_ratio': 17.79399911516525,
'P_curve_rms_rel': 0.01697922151025022,
'P_curve_max_rel': 0.03835942622950839,
'P_final_vs_printed': 0.031167244033872388,
'k_star_printed': 0.25,
'crossover_time_h': 10.102704423976958,
'crossover_time_dNdt_route_h': 10.10295198561339,
'growth_assoc_share': 0.4669289631029462,
'integrated_closure_rel': 0.01727309190923698,
'k_identity_max_rel': 0.027355623100303816,
'invN_identity_max_rel': 0.018409714061888183,
'table1_vs_table2_N_max_rel': 0.033774074074073956,
'table1_vs_table2_N_rms_rel': 0.012495235900000401,
'beta_range_ph6_over_ph45': 5.0,
'alpha_range_ph45_over_ph6': 1.6136363636363635,
'kstar_range_ph6_over_ph45': 8.068181818181818,
'kstar_ph45_per_h': 0.030985915492957747,
'kstar_ph56_per_h': 0.22272727272727272,
'beta_monotone_margin': 0.030000000000000013,
'beta_sum_all_ph': 1.8700000000000003,
'digit_substitution_detection': 0.8736998514115899,
'batch_marcher_order': 1.0080715033106198,
'batch_marcher_finest_rel': 0.006647274302019834,
'pfr_grid_order': 1.0043127341537246,
'pfr_outlet_P_ncell3200': 45.490543201946736,
'pfr_richardson_vs_closed_form': 2.2239563444381716e-05,
'pfr_boundary_over_last_cell': 1.0166551979550138,
'closed_form_P_final': 45.322206094044084,
'closed_form_N_final': 9.687771692759386,
'crossover_two_routes_rel': 2.4503891217553253e-05}}# ---------------------------------------------------------------- prose sweep
# Every number written in the markdown of this notebook, in meta.yaml, in
# README.md and in models_entry.yaml is checked here against the live
# computation. The notebook FAILS TO EXECUTE if any of them drifts.
CLAIMS = [
("alpha refit, eq. (3)", 2.266562, ALPHA_A, 5e-7),
("beta refit, eq. (3)", 0.528684, BETA_A, 5e-7),
("alpha refit vs printed", 0.030256, METRICS["alpha_refit_eq3_vs_printed"], 5e-7),
("beta refit vs printed", -0.038757, METRICS["beta_refit_eq3_vs_printed"], 5e-7),
("alpha refit, eq. (2)", 2.289913, ALPHA_B, 5e-7),
("beta refit, eq. (2)", 0.510117, BETA_B, 5e-7),
("alpha refit, integral form", 2.272660, ALPHA_C, 5e-7),
("beta refit, integral form", 0.510150, BETA_C, 5e-7),
("alpha standard error", 0.130928, SE_ALPHA, 5e-7),
("beta standard error", 0.049837, SE_BETA, 5e-7),
("printed alpha, in se", 0.508390, SE_ALPHA_DIST, 5e-7),
("printed beta, in se", 0.427714, SE_BETA_DIST, 5e-7),
("corr(alpha, beta)", -0.891902, CORR_AB, 5e-7),
("beta given printed alpha", 0.551282, BETA_GIVEN_ALPHA, 5e-7),
("alpha given printed beta", 2.216616, ALPHA_GIVEN_BETA, 5e-7),
("rms penalty of the printed pair", 0.006521, RMS_PENALTY, 5e-7),
("eq. (3) rms", 0.100792, RMS_A, 5e-7),
("eq. (3) R2", 0.937439, R2_A, 5e-7),
("eq. (2) rms", 0.323004, RMS_B, 5e-7),
("integral form rms", 0.153769, RMS_C, 5e-7),
("spread over the three routes, alpha", 0.010302, ALPHA_SPREAD, 5e-7),
("spread over the three routes, beta", 0.036396, BETA_SPREAD, 5e-7),
("null growth-only ratio", 5.549971, METRICS["eq2_null_growth_only_ratio"], 5e-6),
("null density-only ratio", 4.915776, METRICS["eq2_null_density_only_ratio"], 5e-6),
("log-phase null growth-only ratio", 1.036042,
METRICS["eq2_logphase_null_growth_only_ratio"], 5e-6),
("log-phase null density-only ratio", 1.033197,
METRICS["eq2_logphase_null_density_only_ratio"], 5e-6),
("outside-log null growth-only ratio", 5.011873,
METRICS["eq2_outside_log_null_growth_only_ratio"], 5e-6),
("outside-log null density-only ratio", 3.708246,
METRICS["eq2_outside_log_null_density_only_ratio"], 5e-6),
("log-phase two-term rms", 0.102155, METRICS["eq2_logphase_refit_rms"], 5e-6),
("outside-log two-term rms", 0.447426,
METRICS["eq2_outside_log_refit_rms"], 5e-6),
("log-phase k plateau spread", 0.043478, K_PLATEAU_SPREAD, 5e-6),
("crossover, linear-interpolant band", 0.001621, T_CROSS_INTERP_BAND, 5e-6),
("plug-flow order by self-convergence", 1.593616, PFR_ORDER_SELF, 5e-6),
("batch order by self-convergence", 1.601213, MARCH_ORDER_SELF, 5e-6),
("integral null growth-only ratio", 14.241628,
METRICS["integral_null_growth_only_ratio"], 5e-6),
("integral null density-only ratio", 17.793999,
METRICS["integral_null_density_only_ratio"], 5e-6),
("P curve rms", 0.016979, CURVE_RMS, 5e-7),
("P curve max", 0.038359, CURVE_MAX, 5e-7),
("P final predicted", 44.649542, P_FINAL_PRED, 5e-7),
("P final vs printed", 0.031167, P_FINAL_REL, 5e-7),
("k identity max", 0.027356, K_IDENT_MAX, 5e-7),
("invN identity max", 0.018410, Q_IDENT_MAX, 5e-7),
("digit detection fraction", 0.873700, DIGIT_FRAC, 5e-7),
("Table I vs II, max", 0.033774, X_TABLE_MAX, 5e-7),
("Table I vs II, rms", 0.012495, X_TABLE_RMS, 5e-7),
("k star printed", 0.25, K_STAR_PRINTED, 1e-12),
("k star refitted", 0.233254, K_STAR_REFIT, 5e-7),
("crossover time, k column", 10.102704, T_CROSS_K, 5e-7),
("crossover time, dN/dt and N columns", 10.102952, T_CROSS_D, 5e-7),
("crossover, two routes", 2.450e-05, METRICS["crossover_two_routes_rel"], 5e-9),
("crossover as a fraction of the window", 0.728216, T_CROSS_FRAC, 5e-7),
("growth-associated share", 0.466929, GA_SHARE, 5e-7),
("integrated closure", 0.017273, CLOSURE_REL, 5e-7),
("beta range", 5.0, METRICS["beta_range_ph6_over_ph45"], 1e-12),
("alpha range", 1.613636, METRICS["alpha_range_ph45_over_ph6"], 5e-7),
("kstar range", 8.068182, METRICS["kstar_range_ph6_over_ph45"], 5e-7),
("kstar at pH 4.5", 0.030986, METRICS["kstar_ph45_per_h"], 5e-7),
("kstar at pH 5.6", 0.222727, METRICS["kstar_ph56_per_h"], 5e-7),
("closed-form N at 13.5 h", 9.687772, N_REF, 5e-7),
("closed-form P at 13.5 h", 45.322206, P_REF, 5e-7),
("batch marcher order", 1.008072, MARCH_ORDER, 5e-7),
("batch marcher finest", 0.006647, MARCH_FINEST, 5e-7),
("pfr grid order", 1.004313, PFR_ORDER, 5e-7),
("pfr outlet, ncell 3200", 45.490543, PFR_P_FINEST, 5e-6),
("pfr Richardson vs closed form", 2.224e-05, PFR_P_RICH_REL, 5e-8),
("boundary over last-cell, finest", 1.016655, PFR_BOUNDARY_OVER_CENTRE, 5e-6),
("N span down Table II", 78.333333, N_SPAN, 5e-6),
("crossover time, strongest break-row move", 0.065301,
STRONGEST["crossover_time_h"][1], 5e-6),
# THE COUNTS THE METADATA WRITES OUT. A count in README.md or meta.yaml is
# a hand-typed number in a file no computation can rewrite, so each one that
# matters is pinned here against the live value - including the SMALL ones,
# which the integer sweep below cannot see (its class is digit strings of
# two or more digits, and a count written as a word or as "5" is outside
# it). The wrong count this replaces - "three of those six" - was exactly
# that, on three surfaces at once.
("break rows", 28, N_BREAK_ROWS, 0),
("rows that move something", 28, N_MOVING_ROWS, 0),
("row-metric links", 235, N_LINKS, 0),
("rows that mis-transcribe one printed cell", 14, N_CELL_ROWS, 0),
("rows that change a method or a resolution", 14, N_METHOD_ROWS, 0),
("weak metrics now", 0, len(WEAK), 0),
("weak metrics before the review rows", 6, N_WEAK_BEFORE, 0),
("of those, left on the first review's two rows", 5, N_LEFT_FIRST_WAVE, 0),
("of those, left in all", 6, N_LEFT, 0),
("of those, left because of a review row", 6, N_LEFT_VIA_REVIEW, 0),
("weakest cover before the review rows", 0.032496,
max(WEAK_BEFORE_REVIEW.values()), 5e-6),
("weakest cover on the page now", 0.056207, WEAKEST_COVER, 5e-6),
("the outlet-cell k row, on the boundary/last-cell ratio", 0.056207,
_ratio_out, 5e-6),
("the same substitution one row earlier, on that ratio", 0.001466,
_ratio_in, 5e-7),
]
bad = [(n, w, float(g)) for n, w, g, t in CLAIMS if abs(float(g) - w) > t]
assert not bad, "PROSE DRIFT:\n" + "\n".join(
f" {n}: page says {w!r}, live value {g!r}" for n, w, g in bad)
print(f"{len(CLAIMS)} prose/metadata values checked against the live"
f" computation: all agree.")
# ---- mechanical sweep of the metadata FILES AND THIS NOTEBOOK'S OWN PROSE ---
# TWO token classes are swept, because the first version of this sweep caught
# only one and both of the page's factual errors came through the gap:
# DECIMALS, five or more places - the original sweep. Five rather than four
# excludes the DOI (10.1002/...) without an exception list.
# INTEGERS of two or more digits - added after a review found "167 row-metric
# links" on three surfaces while the notebook printed 176, and "29 rows"
# stated for a CSV whose next cell printed 30. EVERY COUNT ON THIS PAGE IS
# AN INTEGER, and the decimal sweep could not see a single one of them.
# The notebook's own markdown is swept too, for the same reason: "29 rows" was
# written there, not in the metadata, so the file list did not cover it.
import re
LIVE = set(float(v) for v in METRICS.values())
LIVE.update([ALPHA_A, BETA_A, ALPHA_B, BETA_B, ALPHA_C, BETA_C, SE_ALPHA,
SE_BETA, SE_ALPHA_DIST, SE_BETA_DIST, CORR_AB, BETA_GIVEN_ALPHA,
ALPHA_GIVEN_BETA, BETA_GIVEN_ALPHA_REL, ALPHA_GIVEN_BETA_REL,
RMS_A, RMS_B, RMS_C, RMS_PRINTED, RMS_PENALTY, R2_A, R2_B,
R2_A_ONLY, R2_B_ONLY, A_ONLY, B_ONLY, A_ONLY_INT, B_ONLY_INT,
RMS_A_ONLY, RMS_B_ONLY, RMS_A_ONLY_INT, RMS_B_ONLY_INT,
CURVE_RMS, CURVE_MAX, CURVE_RMS_REFIT, CURVE_MAX_REFIT,
P_FINAL_PRED, P_FINAL_REL, K_IDENT_MAX, K_IDENT_MEAN, Q_IDENT_MAX,
DIGIT_FRAC, X_TABLE_MAX, X_TABLE_RMS, X_TABLE_LIN_MAX,
K_STAR_PRINTED, K_STAR_REFIT, T_CROSS_K, T_CROSS_D, T_CROSS_FRAC,
GA, NG, GA_SHARE, TOT_MODEL, TOT_OBS, CLOSURE_REL, N_REF, P_REF,
MARCH_ORDER, MARCH_FINEST, PFR_ORDER, PFR_P_RICH, PFR_P_RICH_REL,
PFR_P_FINEST, PFR_CENTRE_ORDER, PFR_BOUNDARY_OVER_CENTRE,
PFR_BOUNDARY_OVER_CENTRE_COARSE,
ALPHA_SPREAD, BETA_SPREAD, A_REL_A, B_REL_A, A_REL_B, B_REL_B,
A_REL_C, B_REL_C, GAIN_A_ONLY, GAIN_B_ONLY, GAIN_A_ONLY_INT,
GAIN_B_ONLY_INT])
LIVE.update([float(x) for x in MARCH_ERR] + [float(x) for x in MARCH_ORDERS])
LIVE.update([float(x) for x in PFR_ERR] + [float(x) for x in PFR_ORDERS])
LIVE.update([float(x) for x in PFR_CENTRE_ERR]
+ [float(x) for x in PFR_CENTRE_ORDERS])
LIVE.update([float(v) for v in T3S.k_star_per_h])
LIVE.update([float(x) for _, g in BREAKS for x in g.values()])
LIVE.update([K_PLATEAU_SPREAD, K_PLATEAU_LO, K_PLATEAU_HI, RMS2_LOG, RMS2_OUT,
GAIN_A_LOG, GAIN_B_LOG, GAIN_A_OUT, GAIN_B_OUT, ALPHA_LOG, BETA_LOG,
T_CROSS_K_LIN, T_CROSS_INTERP_BAND, PFR_ORDER_SELF,
MARCH_ORDER_SELF, N_SPAN, K_GAP_LO])
# the MEASURED MOVES themselves are quoted in prose, so they are live values too
LIVE.update([mv for rows in COVERAGE.values() for _, mv in rows])
LIVE.update([abs(x) for x in list(LIVE)]) # signs are written as words
LIVE.update([100.0*x for x in list(LIVE)]) # percentages
LIVE = {x for x in LIVE if np.isfinite(x)}
# EVERY COUNT THE COMPUTATION PRODUCES. An integer token in the prose must be
# one of these or one of the pinned source-derived integers below.
LIVE_INT = {len(T1), len(T2), len(T3), len(_k), len(_q), len(_n2), len(_f2),
len(_f3), len(_fp), len(_kk), N_FIT3, int(_m.sum()),
DIGIT_TOTAL, DIGIT_CAUGHT, DIGIT_TOTAL - DIGIT_CAUGHT,
len(METRICS), len(BREAKS), N_LINKS, N_MOVING_ROWS, len(WEAK),
N_CELL_ROWS, N_METHOD_ROWS, N_WEAK_BEFORE, N_LEFT,
len(SECOND_ROUTES), N_ALL, N_LOG, N_OUT, N_OUT_EARLY, ALPHA_FLAT_N,
len(CLAIMS), N_BELOW_FLOOR, int(round(100*CI_REL_TOL)),
len(T3S), len(BREAK_FNS), len(NUM_ROWS), int(N_SPAN)}
LIVE_INT.update(MARCH_NT)
LIVE_INT.update(PFR_N)
if globals().get("J41") is not None:
LIVE_INT.add(len(J41))
# A MEASURED MOVE written as a whole-number percentage - "2800 %" - is the same
# claim as the float 28.0 and must be checkable as one. ONLY the break-row
# moves are admitted this way, and only when they are exact integers: taking
# 100x of every live value would license hundreds of spurious integers. (It
# did, in the first draft of this sweep: a corrupted beta_sum_all_ph of 1.67
# licensed the token 167, which is precisely the wrong count this sweep exists
# to catch. The assertion at the end of the cell now checks that it does not.)
LIVE_INT.update(int(round(100*mv)) for rows in COVERAGE.values()
for _, mv in rows if abs(100*mv - round(100*mv)) < 1e-9)
# THE DIGITS OF A PRINTED TABLE CELL. Mid-dot decimals lose their point when a
# token is read out of prose - "0.46" leaves "46", "4.5" leaves "45" - so every
# printed cell of the three CSVs is admitted at 1x, 10x and 100x. This set is
# derived from the loaded data, not typed: it moves when the transcription does.
TABLE_INTS = set()
for _df in (T1, T2, T3):
for _v in np.asarray(_df.to_numpy(), dtype=float).ravel():
if not np.isfinite(_v):
continue
for _s in (_v, 10*_v, 100*_v):
if abs(_s - round(_s)) < 1e-9 and 0 < _s < 1e8:
TABLE_INTS.add(int(round(_s)))
# INTEGERS QUOTED ONLY IN ORDER TO BE RETRACTED. This page names the wrong
# numbers a review found in it, so the wrong numbers are in its prose on
# purpose; they are pinned here so that naming them cannot be confused with
# claiming them.
RETRACTED_INTS = {29, 37, 167, 176}
# VALUES THIS PAGE INJECTS AS DEFECTS and quotes when describing the break row.
INJECTED_INTS = {35} # Table III, pH 6.0 beta read 0.35 instead of 0.55
# INTEGERS THIS PAGE READS OFF THE SOURCE DOCUMENT OR ITS OWN PROVENANCE. The
# sweep CANNOT check these - they come from page images and file metadata, not
# from the computation - so they are pinned by value and named, and the teeth
# measurement below reports honestly how much that costs.
SOURCE_INTS = {
1959, 393, 412, # year and page range of the article
398, 400, 401, 402, 406, 407, 408, 409, 410, 411, # book pages cited
125, # the U.O.D. definition, N = 0.125 r
11, 111, # the text layer's "Table 11" / "Table 111"
10, 12, 14, 15, 17, 18, 20, # PDF page numbers and grep line context
150, 300, # render/native ppi
450, # 150,000,000-450,000,000 cells per U.O.D.
2026, # dates in the provenance notes
885270, # bytes of the PDF
38, # area of the page's one true hyphen
1023, 1026, 545, 547, 1030, 1044, # pixel bounds of the mark and the zero
43, 45, 96, # 43.3 mg/ml, 45 C, 96 per cent recoveries
49, 55, 26, 32, # mid-dot table values: 0.49, 0.55, ...
75, # 75 per cent transmission
16, # 16x grid refinement span
392, # book page = PDF page + 392
}
def _int_tokens(text):
"""Integers of 2+ digits, standing alone, no leading zero.
A leading zero never marks a count on this page - it marks a date field
(2026-08-02) or a thousands group (150,000,000) - so those are skipped
rather than mis-parsed, and the skip is counted and reported.
"""
out, skipped = [], 0
for t in INT_TOKEN.findall(text):
if t.startswith("0"):
skipped += 1
continue
out.append(t)
return out, skipped
TOKEN = re.compile(r"(?<![\w.])(\d+\.\d{5,})(?![\d])")
INT_TOKEN = re.compile(r"(?<![\w.])(\d{2,})(?![\w.])")
FILES = ["meta.yaml", "README.md",
"data/luedeking1959-table1-bacterial-density.meta.yaml",
"data/luedeking1959-table2-growth-acid.meta.yaml",
"data/luedeking1959-table3-alpha-beta-vs-ph.meta.yaml",
"../models_entry.yaml",
"index.ipynb"] # markdown cells only; see _read_swept
# THE TOKEN COUNTS ARE SHAPE-DEPENDENT AND BOTH SHAPES ARE PINNED.
# integrate_case.py copies `page/` only and splices `models_entry.yaml` into the
# repository's models.yaml, so that file is swept HERE, in the queue tree, and is
# absent - and counted as absent - in the published page. On Colab neither the
# metadata nor the notebook file is reachable. Quoting one count in the metadata
# while the shipped page printed the other is exactly the drift this exists to
# catch.
SWEEP_TOKENS_BY_SHAPE = {7: 80, 6: 57} # 5+-decimal tokens
SWEEP_INTS_BY_SHAPE = {7: 517, 6: 470} # 2+-digit integer tokens
def _read_swept(fn):
"""Text of a swept file - for the notebook, its MARKDOWN cells only.
Sweeping the notebook's code would sweep grid sizes and solver tolerances,
which are code and not claims; its markdown is prose about the results and
is exactly where an untested count can hide.
"""
txt = Path(fn).read_text(encoding="utf-8")
if fn.endswith(".ipynb"):
return "\n".join("".join(c["source"]) for c in json.loads(txt)["cells"]
if c["cell_type"] == "markdown")
return txt
def _half_ulp(tok):
return 0.5*10**(-len(tok.split(".")[1]))
def _matches(tok):
v, h = float(tok), _half_ulp(tok)
return any(abs(v - c) <= h*(1 + 1e-9) for c in LIVE)
def _int_matches(tok):
v = int(tok)
return (v in LIVE_INT or v in TABLE_INTS or v in SOURCE_INTS
or v in RETRACTED_INTS or v in INJECTED_INTS)
tokens, unmatched, rejected, corrupted = [], [], 0, 0
ints, int_unmatched, int_rejected, int_live, int_skipped = [], [], 0, 0, 0
for fn in FILES:
fp = Path(fn)
if not fp.is_file():
print(f" (skipped, not present next to the notebook: {fn})")
continue
text = _read_swept(fn)
for t in TOKEN.findall(text):
tokens.append((fn, t))
if not _matches(t):
unmatched.append((fn, t))
bad_tok = t[:-1] + str((int(t[-1]) + 5) % 10)
corrupted += 1
if not _matches(bad_tok):
rejected += 1
got, skipped = _int_tokens(text)
int_skipped += skipped
for t in got:
ints.append((fn, t))
if not _int_matches(t):
int_unmatched.append((fn, t))
if int(t) in LIVE_INT or int(t) in TABLE_INTS:
int_live += 1
bad_tok = t[:-1] + str((int(t[-1]) + 5) % 10)
if not _int_matches(bad_tok):
int_rejected += 1
found, found_int = len(tokens), len(ints)
n_files = len([f for f in FILES if Path(f).is_file()])
assert not unmatched, f"metadata numbers with no live counterpart: {unmatched}"
assert not int_unmatched, (
f"integer counts with no live and no pinned-source counterpart:"
f" {sorted(set(t for _, t in int_unmatched))} in"
f" {sorted(set(f for f, _ in int_unmatched))}")
_pin, _pin_int = (SWEEP_TOKENS_BY_SHAPE.get(n_files),
SWEEP_INTS_BY_SHAPE.get(n_files))
assert _pin in (None, found), (
f"the sweep found {found} decimal tokens in the {n_files}-file shape, not"
f" the {_pin} pinned for it")
assert _pin_int in (None, found_int), (
f"the sweep found {found_int} integer tokens in the {n_files}-file shape,"
f" not the {_pin_int} pinned for it")
if _pin is not None:
print(f" the counts are shape-dependent and BOTH shapes are pinned:"
f" {SWEEP_TOKENS_BY_SHAPE[7]} decimal and {SWEEP_INTS_BY_SHAPE[7]}"
f" integer tokens\n across the seven files in the queue tree,"
f" {SWEEP_TOKENS_BY_SHAPE[6]} and {SWEEP_INTS_BY_SHAPE[6]} in the"
f" published page, where\n ../models_entry.yaml has been spliced into"
f" models.yaml; the {n_files}-file shape is the one\n executing here"
f" and it is the pair asserted.")
print(f"mechanical sweep of {n_files} of the {len(FILES)} files"
f" (metadata + this notebook's markdown):")
print(f" {found} numbers written to 5+ decimals, all matching a live value to"
f" half an ulp of\n their own printed digits."
f" Teeth: {rejected}/{corrupted}"
f" ({rejected/max(corrupted, 1):.1%}) of last-digit corruptions rejected.")
print(f" {found_int} integers of 2+ digits ({int_skipped} leading-zero tokens"
f" skipped as dates and\n thousands groups): {int_live} match a COUNT the"
f" computation produced or a printed table cell; the other"
f" {found_int - int_live}\n sit in the"
f" pinned sets - source-derived constants (book pages, ppi, pixel bounds,"
f"\n the year), the values this page injects as defects, and the wrong"
f" numbers it quotes\n in order to retract them - none of which any"
f" computation here can check.")
print(f" ACHIEVED DETECTION RATE, NOT COMPLETENESS: {int_rejected}/{found_int}"
f" ({int_rejected/max(found_int, 1):.1%}) of last-digit\n corruptions of"
f" those integers are rejected. The rest land on another allowed value -"
f"\n small counts and source constants are dense - so this sweep RAISES"
f" the cost of a\n wrong count, it does not make one impossible. What it"
f" WOULD have caught, both of\n them real: the metadata's \"167 row-metric"
f" links\" while this notebook printed 176\n (it prints {N_LINKS} now),"
f" and \"29 rows\" written of a CSV this page loads and whose\n length is"
f" {len(J41) if globals().get('J41') is not None else 'unavailable here'}."
f" THAT IS CHECKED, NOT CLAIMED:")
_would_catch = {n: (n not in LIVE_INT and n not in TABLE_INTS
and n not in SOURCE_INTS and n not in INJECTED_INTS)
for n in (167, 29)}
assert all(_would_catch.values()), (
f"a wrong count this sweep is advertised as catching now matches an allowed"
f" value: {_would_catch}")
for n, caught in _would_catch.items():
print(f" {n:4d} is rejected by the live and source sets: {caught}"
f" (it is allowed only by RETRACTED_INTS, which exists so that naming"
f" a\n past error is not the same as making one)")
# AND WHAT IT CANNOT SEE AT ALL - COUNTED, NOT HEDGED. The integer class above
# is DIGIT STRINGS OF TWO OR MORE DIGITS. Two whole classes of count fall
# outside it: a count SPELLED AS A WORD, and a count written as a SINGLE DIGIT.
# This is not hypothetical - the most recent factual error found on this page
# was "THREE of those six were weak", a word-spelled count that was wrong by two
# and sat on three surfaces at once, in prose this sweep reads every time it
# runs and could not check at any setting. Bringing word numbers into the
# matcher was tried and rejected ON MEASUREMENT rather than on taste: the small
# integers this page legitimately produces are so dense that essentially every
# such token would match something, and the sweep would then report teeth it
# does not have. WHAT PROTECTS THOSE COUNTS INSTEAD IS THE CLAIMS LIST ABOVE -
# every count the metadata states is now checked against the live value there,
# and the ones in the retraction block are printed by the computation itself.
WORD_INT = re.compile(r"(?<![\w-])(zero|one|two|three|four|five|six|seven|eight"
r"|nine|ten|eleven|twelve|thirteen|fourteen|fifteen"
r"|sixteen|seventeen|eighteen|nineteen|twenty)(?![\w-])",
re.IGNORECASE)
ONE_DIGIT = re.compile(r"(?<![\w.,])(\d)(?![\w.,])")
n_word = n_one = 0
for fn in FILES:
if not Path(fn).is_file():
continue
_t = _read_swept(fn)
n_word += len(WORD_INT.findall(_t))
n_one += len(ONE_DIGIT.findall(_t))
print(f" OUTSIDE THE SWEEP ENTIRELY, and counted so that it is not mistaken for"
f" covered:\n {n_word} word-spelled small integers and {n_one}"
f" single-digit numbers stand in the swept\n prose. NEITHER TOKEN CLASS"
f" IS CHECKED HERE against anything. The counts that\n matter are pinned"
f" one by one in CLAIMS above instead - {len(CLAIMS)} values, including"
f"\n every count this page's metadata states about its own break table -"
f" and the\n blind-spot block prints its counts from the coverage map"
f" rather than writing them.")
# structural assertions, asserted rather than asserted-by-eye
assert SE_ALPHA_DIST < 1.0 and SE_BETA_DIST < 1.0, (
"the printed pair is no longer inside one standard error of the refit")
assert RMS_PENALTY < 0.01, "the printed pair no longer sits on the fit ridge"
assert GAIN_A_ONLY > 2 and GAIN_B_ONLY > 2, "a one-term null now fits as well"
assert T_LO < T_CROSS_K < T_HI
assert 0.9 < MARCH_ORDER < 1.15 and 0.9 < PFR_ORDER < 1.15
assert PFR_BOUNDARY_OVER_CENTRE > 1.0, (
"the boundary read is no longer the LESS accurate of the two, which is the"
" measured claim this page makes against the standing advice")
print("structural assertions: all pass.")82 prose/metadata values checked against the live computation: all agree.
(skipped, not present next to the notebook: ../models_entry.yaml)
the counts are shape-dependent and BOTH shapes are pinned: 80 decimal and 517 integer tokens
across the seven files in the queue tree, 57 and 470 in the published page, where
../models_entry.yaml has been spliced into models.yaml; the 6-file shape is the one
executing here and it is the pair asserted.
mechanical sweep of 6 of the 7 files (metadata + this notebook's markdown):
57 numbers written to 5+ decimals, all matching a live value to half an ulp of
their own printed digits. Teeth: 57/57 (100.0%) of last-digit corruptions rejected.
470 integers of 2+ digits (26 leading-zero tokens skipped as dates and
thousands groups): 324 match a COUNT the computation produced or a printed table cell; the other 146
sit in the pinned sets - source-derived constants (book pages, ppi, pixel bounds,
the year), the values this page injects as defects, and the wrong numbers it quotes
in order to retract them - none of which any computation here can check.
ACHIEVED DETECTION RATE, NOT COMPLETENESS: 202/470 (43.0%) of last-digit
corruptions of those integers are rejected. The rest land on another allowed value -
small counts and source constants are dense - so this sweep RAISES the cost of a
wrong count, it does not make one impossible. What it WOULD have caught, both of
them real: the metadata's "167 row-metric links" while this notebook printed 176
(it prints 235 now), and "29 rows" written of a CSV this page loads and whose
length is 30. THAT IS CHECKED, NOT CLAIMED:
167 is rejected by the live and source sets: True (it is allowed only by RETRACTED_INTS, which exists so that naming a
past error is not the same as making one)
29 is rejected by the live and source sets: True (it is allowed only by RETRACTED_INTS, which exists so that naming a
past error is not the same as making one)
OUTSIDE THE SWEEP ENTIRELY, and counted so that it is not mistaken for covered:
443 word-spelled small integers and 410 single-digit numbers stand in the swept
prose. NEITHER TOKEN CLASS IS CHECKED HERE against anything. The counts that
matter are pinned one by one in CLAIMS above instead - 82 values, including
every count this page's metadata states about its own break table - and the
blind-spot block prints its counts from the coverage map rather than writing them.
structural assertions: all pass.What pymrm adds
Honestly: not much to the fit, and the page says so. Refitting a two-parameter linear model to 22 printed rows is numpy.linalg.lstsq, and pymrm is not involved in the headline numbers at all. What pymrm adds is downstream of the fit, and it is worth two things.
1. It makes the relation composable. Eq. (2) is a source term, and once it is written as one it drops into a batch marcher and into a plug-flow fermenter with no change to the kinetics - the same source(c) function serves both, handed to NumJac in the shape whose last axis is the field index. That is the form the Summary’s “rational design of continuous fermentation processes” needs and the paper never writes.
2. It gives the relation a closed form to be checked against, which the fit does not have. With \(k(t)\) prescribed, eq. (2) integrates exactly, so both discretisations have an analytic reference - and both come back first order, as backward Euler and donor-cell upwind must. That is the whole of the numerical validation on this page and it is deliberately modest.
What pymrm does not add here, stated plainly: no new physics, no extension of the model to conditions the paper did not measure, and no resolution of the five pH levels whose data are not printed. The plug-flow result is an illustration of composability, not a prediction anyone has tested.
Reuse
Fit \(\alpha\) and \(\beta\) in the variables you will report them in, and say which. Eq. (3) and eq. (2) are the same model, but least squares on them are two different fits - the second is the first weighted by \(N^2\), and \(N\) spans a factor of 78 down this run. Here that is worth 1.0 % on \(\alpha\) and 3.6 % on \(\beta\): small, but larger than the difference between this page’s fit and the authors’ straight edge.
Quote the pair, not the constants. \(\alpha\) and \(\beta\) come out of this fit anticorrelated at \(-0.89\). A refit that lands 3 % high on \(\alpha\) and 4 % low on \(\beta\) has not disagreed with anything: hold \(\alpha\) at the other value and \(\beta\) returns to within 0.23 %, and the two pairs differ by 0.65 % in residual. Report \(k^{*} = \beta/\alpha\) alongside them - it is the combination that is actually well determined, it has physical meaning (the specific growth rate at which the two mechanisms contribute equally), and the paper’s own qualitative account of the fermentation is a statement about it.
A two-term product law is not decoration. Against its own two one-term degenerate cases, each fitted with its own best constant, the two-term form is 5.5x and 4.9x better in rms on the rate data and 14x and 18x better on the integrated acid curve. Over a whole batch the two terms contribute 46.7 % and 53.3 % of the acid - neither is a correction to the other, even though each dominates one half of the run.
Before you trust a printed rate column, check it against the columns it was divided by. Table II’s \(k\) and \((1/N)(\mathrm{d}P/\mathrm{d}t)\) are quotients of its other columns by the paper’s own definition, and testing that caught 87.4 % of all single-digit substitutions in this transcription. Where a table offers no such identity - Table III offers none at all - say so, and do not pretend a pixel argument is an arithmetic one.
And the scope lesson, which is the transferable one. This paper’s headline claim is that \(\alpha\) and \(\beta\) depend on pH, and it prints six pairs to support it. Six fitted constants are six outputs of a test, not the test: the form is tested by the linearity of \((1/N)(\mathrm{d}P/\mathrm{d}t)\) against \(k\), and the paper prints those points for exactly one of the six levels. When a source gives you fitted parameters at \(n\) conditions and raw data at one, what you can check is one condition. Check that one properly and scope the rest out; do not digitise the figure to manufacture the other five.