try:
    import pymrm
except ImportError:
%pip install -q pymrm pyyamlBET 1938: the theory that yields the surface, against the theory that has to be given it
sec:J
struct:S1
struct:S10
tier:T0
data:tier6
phase:gas-solid
Brunauer, Emmett and Teller open by refuting a rival — the polarization theory of de Boer, Zwicker and Bradley — and only then derive their own isotherm. This page rebuilds both. The refutation is reproduced from its own constants: the inter-layer dipole ratio comes out 0.0102 where Bradley’s fit needs 0.989, a factor 96.8, and Bradley’s k lies outside the domain in which the polarization recursion has any decaying solution at all — confirmed by solving that recursion instead of quoting its closed form. The BET side is then separated into what was fitted and what was not: the seven-gas surface agreement is a real out-of-sample test that collapses a 46.9 % spread in v_m to 10.6 %, while the celebrated agreement between v_m and point B is shown to be near-guaranteed by the equation’s own shape — the BET inflection point cannot exceed 2/sqrt(3) v_m for any c, a ceiling here derived in closed form and root-found independently. One printed statement does not survive: ‘840 +- 70 cal. for nitrogen on all twelve adsorbents’ is the eleven-row number.
BET 1938: the theory that yields the surface, against the theory that has to be given it
Catalog ID: J1.3 · Structures: S1 (pointwise algebra / equilibrium ladder), S10 (constrained algebraic system) · Tier: T0
Almost everybody meets the BET equation as a line to draw through five points:
\[\frac{p}{v\,(p_0-p)} \;=\; \frac{1}{v_\mathrm{m}c} \;+\; \frac{c-1}{v_\mathrm{m}c}\,\frac{p}{p_0}. \tag{A}\]
Two parameters, fitted over \(0.05 < p/p_0 < 0.35\), and the fit is good. That tells you nothing. A two-parameter fit over a fifth of an isotherm’s range is supposed to be good, and the theory Brunauer, Emmett and Teller were arguing against could fit the same isotherms too — de Boer and Zwicker’s polarization theory had been doing exactly that for nine years, and the paper says so on its first page.
So this page is organised the way the paper is, not the way the textbooks are. Section I of the 1938 paper is a refutation of a competitor, carried out with numbers, before a single line of the BET derivation appears. That refutation is the page’s spine, because it is the only part of the argument where two theories are made to disagree about something measurable.
Three questions, in order.
- Can the rival theory be dismissed on its own constants? The paper says yes and prints the whole chain. Reproduced here: \(\alpha/r^3 = 0.029\) for argon from the refractive index and the solid density, a lattice constant \(d = -0.35\), and hence an inter-layer dipole ratio \(C = -0.0102\) — against the \(0.989\) that Bradley’s own fitted \(k = 0.615\) implies. That is a factor 96.8 in \(C\) and 9361 in the binding energy it transmits. And Bradley’s \(k\) is not merely large: it is outside the range where the polarization recursion has a decaying solution at all, which this page shows by solving the recursion rather than by quoting its closed form.
- Which parts of the BET case are fits, and which are tests? Kept strictly apart. The isotherm agreement is a fit and is labelled one everywhere. The thing that is not a fit is that seven different gases, each with its own fitted \(v_\mathrm{m}\), must give the same surface area once converted through cross-sections computed from bulk densities — a conversion with no adsorption in it. That collapses a 46.9 % spread in \(v_\mathrm{m}\) to 10.6 % in area on silica gel, and 18.6 % to 7.9 % on charcoal. The polarization theory cannot even be asked this question: it has no \(v_\mathrm{m}\), and de Boer and Zwicker could not evaluate \(K_1\) because the surface was unknown.
- Is the famous \(v_\mathrm{m} \approx\) point B agreement evidence? Much less than it looks. This page derives, in closed form and confirms by root-finding, that the BET isotherm’s inflection point can never sit above \(2/\sqrt{3} = 1.1547\,v_\mathrm{m}\) for any \(c\) whatever, attained at \(c = 27+15\sqrt3\). An eye-read landmark at or below that inflection therefore cannot exceed \(v_\mathrm{m}\) by more than 15.5 % — a one-sided bound: it can still sit arbitrarily far below, and on Table III’s butane isotherm point B is 52 % below \(v_\mathrm{m}\). The authors report the two “seldom differing by as much as 10 %” over the twelve isotherms of Table I; the shape of their own equation had already promised the upper half of that.
Along the way one printed statement is shown to be wrong, in the F2.3 order — pin what is not free first. The paper’s own \(\pm\) notation is decoded exactly from Table II (four gases, four hits — centre to the nearest 10 cal, half-width to the nearest 5), and applied to Table I it shows that “\(E_1-E_\mathrm{L}\) is uniformly \(840 \pm 70\) cal. […] for nitrogen on all twelve adsorbents” is the number eleven of those twelve give. The twelve give \(824.5 \pm 86.5\), which rounds to \(820 \pm 85\) (or \(820 \pm 90\) on the coarser half-width rule), and two rows fall outside the band as printed.
Background
Two explanations of one curve
By the mid-1930s it was settled that low-temperature van der Waals isotherms on most adsorbents are S-shaped: concave to the pressure axis at low \(p\), convex at high \(p\). It was not settled why. The paper’s own opening sentence lists the two camps — capillary condensation, and the build-up of multimolecular layers — and then names the only quantitative account of the second that existed:
The isotherm equation which they, and later Bradley, derived on the basis of this polarization theory is practically the only quantitative expression that has been so far proposed to account for multimolecular adsorption.
The polarization theory. De Boer and Zwicker supposed the adsorbent polarizes the first adsorbed layer, that layer polarizes the second, and so on. With \(\mu_i\) the dipole moment in layer \(i\):
\[\mu_i = c_1 C^i, \tag{1} \qquad \phi_i = c_2 C^{2i}, \tag{2}\]
binding energy going as the square of the moment. A Boltzmann equilibrium for the top layer, \(p_n = c_3 e^{-\phi_n/RT}\) (3), then gives
\[\ln\frac{p_n}{c_3} = -\frac{c_2}{RT}\,C^{2n}, \tag{4} \qquad\Longleftrightarrow\qquad \ln\frac{p_n}{K_3 p_0} = K_2 K_1^{\,n}. \tag{4a}\]
Substituting \(n = v/v_\mathrm{m}\) makes (4a) an isotherm. In its logarithmic form with \(K_3 = 1\) it is the familiar empirical statement that a plot of \(\log\log(p/p_0)\) against the amount adsorbed is straight, which, the paper notes, “has often been found to be linear over a considerable range of \(p/p_0\) values”.
Two things make this a genuine rival rather than a straw man. It fits: “DeBoer in several papers showed that various experimental adsorption isotherms could be fitted by equation (4a).” And it had been used to extract physics: Bradley applied it to argon on copper and aluminium sulfate, got \(k \approx 0.6\), and concluded that very strong polarization explained adsorbed films of more than 30 layers at half the saturation pressure.
Why that is testable. \(C\) is not a free parameter. It is the ratio of induced dipoles in successive layers, and induced dipoles are computable from a polarizability and a lattice. Section I of the paper computes it. That is the whole refutation, and it is the part of the argument this page can check hardest, because every input is printed.
The BET answer. Section II then generalises Langmuir’s kinetic derivation from one layer to many, assuming only that the second and all higher layers behave like the liquid: same heat (\(E_2 = E_3 = \dots = E_\mathrm{L}\)), same evaporation–condensation ratio (\(b_i/a_i = g\)). Two constants survive, \(v_\mathrm{m}\) and \(c\), and the second turns out to carry the first-layer heat.
What is on this page and what is not
J1.5 owns adsorption breakthrough; this page owns the equilibrium relation and, above all, the discrimination between it and the theory it displaced. No curve is digitised anywhere and no figure is reproduced. The paper’s isotherms exist in it only as drawn curves, and everything used here is either a printed table, a printed sentence, or a block of constants typeset inside a figure frame. Where a figure’s constants are used, the page says so.
The published model
Transcribed from renders of the original at the scan’s native 300 ppi, with every constant cropped and re-read at digit scale. Equation numbers are the paper’s own; the four lettered equations (A), (B), (C), (E) are lettered in the paper too.
Section I — the polarization theory, and its own arithmetic
The polarization recursion, from footnote 3 on journal page 309:
\[\mu_i = k\,(\mu_{i-1} + \mu_{i+1}), \tag{1a}\]
which (1) solves if
\[C = \frac{1-\sqrt{1-4k^2}}{2k}, \tag{1b} \qquad\text{de Boer and Zwicker's approximation}\quad C = \frac{k}{1-k^2}. \tag{1c}\]
Equation (1b) is real only for \(k \le 1/2\), and the footnote says so explicitly, immediately after recording that Bradley derived \(k = 0.6075\) and \(k = 0.615\) using (1c).
The magnitude of \(C\), journal page 310. Polarizability from the refractive index, nearest-neighbour distance from the solid molar volume in a face-centred-cubic lattice:
\[2\pi\alpha = (n-1)\,v_\mathrm{g}, \tag{5} \qquad r^3 = \sqrt{2}\,v_\mathrm{s}, \tag{6}\]
\[\frac{\alpha}{r^3} = \frac{n-1}{2^{3/2}\pi}\,\frac{v_\mathrm{g}}{v_\mathrm{s}}. \tag{7}\]
For argon at 0 °C and 760 mm, \(n-1 = 278\times10^{-6}\), and with the density of solid argon at 40 K,
\[\alpha/r^3 = 0.029, \tag{8} \qquad \frac{\mu_{i+1}}{\mu_i} = C = d\,(\alpha/r^3), \tag{9}\]
with \(d = -0.35\) for close-packed spheres with the dipoles normal to the surface. Footnote 10 gives the lattice sums behind \(d\) and the reduced recursion
\[\mu_i = \frac{\alpha}{r^3}\Bigl\{-11.1\,\mu_i - 0.466\,(\mu_{i-1}+\mu_{i+1})\Bigr\} \;\;\longrightarrow\;\; \mu_i = -0.35\,\frac{\alpha}{r^3}\,(\mu_{i-1}+\mu_{i+1}),\]
so that \(k = 0.35\,\alpha/r^3\) and, since \(k \ll 1\), \(k \approx C\). The result on journal page 311: \(C = -0.01\), and \(K_1 = C^2 \approx 1\times10^{-4}\).
Section II — the BET derivation
\(s_i\) is the surface area covered by exactly \(i\) layers. Equilibrium of the bare surface with the first layer, and then of every layer with the next:
\[a_1 p\,s_0 = b_1 s_1 e^{-E_1/RT}, \tag{10} \qquad a_2 p\,s_1 = b_2 s_2 e^{-E_2/RT}, \tag{11} \qquad a_i p\,s_{i-1} = b_i s_i e^{-E_i/RT}. \tag{12}\]
Total area and total volume:
\[A = \sum_{i=0}^{\infty} s_i, \tag{13} \qquad v = v_0 \sum_{i=0}^{\infty} i\,s_i, \tag{14} \qquad \frac{v}{v_\mathrm{m}} = \frac{\sum_{i=0}^{\infty} i s_i}{\sum_{i=0}^{\infty} s_i}. \tag{15}\]
The two simplifying assumptions — the whole physical content of the model:
\[E_2 = E_3 = \dots = E_i = E_\mathrm{L}, \tag{16} \qquad \frac{b_2}{a_2} = \frac{b_3}{a_3} = \dots = \frac{b_i}{a_i} = g. \tag{17}\]
They give \(s_1 = y s_0\) with \(y = (a_1/b_1)p\,e^{E_1/RT}\) (18), \(s_2 = x s_1\) with \(x = (p/g)e^{E_\mathrm{L}/RT}\) (19), and hence \(s_i = x^{i-1}s_1 = c x^i s_0\) (20)–(21) with
\[c = \frac{y}{x} = \frac{a_1 g}{b_1}\,e^{(E_1-E_\mathrm{L})/RT}. \tag{22}\]
Summing the two geometric series (23)–(25),
\[\frac{v}{v_\mathrm{m}} = \frac{c\,x}{(1-x)(1-x+c\,x)}, \tag{26} \qquad x = p/p_0, \tag{27}\]
\[v = \frac{v_\mathrm{m}\,c\,p}{(p_0-p)\bigl[1+(c-1)(p/p_0)\bigr]}, \tag{28}\]
which is eq. (A) rearranged. Its low-pressure limit is Langmuir’s (29). If no more than \(n\) layers can build up:
\[v = \frac{v_\mathrm{m}\,c\,x}{1-x}\;\frac{1-(n+1)x^n+n\,x^{n+1}}{1+(c-1)x-c\,x^{n+1}}, \tag{B}\]
with the two limits the paper names: \(n=1\) gives Langmuir, \(n=\infty\) gives (A). At \(n=1\) eq. (B) is also written as
\[\frac{p}{v} = \frac{p_0}{c\,v_\mathrm{m}} + \frac{p}{v_\mathrm{m}}, \tag{E}\]
the form used for charcoal, the one adsorbent in the paper that gave no S-shaped isotherm. Footnote 18 adds two further generalisations, (C) with a distinct first-layer packing and second-layer heat, and (D) with a distribution of capillary sizes; neither is exercised numerically in the paper and neither is used here, which the page states rather than leaving them to look supported.
Finally, footnote 16 supplies the reading of \(c\) used throughout the tables:
\[c = \frac{a_1 b_2}{b_1 a_2}\,e^{(E_1-E_\mathrm{L})/RT} \;\approx\; e^{(E_1-E_\mathrm{L})/RT}, \qquad E_1-E_\mathrm{L} = 2.303\,RT\log c,\]
on the argument that \(a_1b_2/b_1a_2\) “will not differ much from unity”.
And the direction of that arrow is the whole story about \(c\) on this page. Journal page 313 says which quantity is derived from which: “From them the values of \(v_\mathrm{m}\) and \(c\) can be evaluated as explained in the previous section. From \(c\) one can obtain an approximate value for \(E_1-E_\mathrm{L}\).\(^{16}\)” Every \(E_1-E_\mathrm{L}\) printed in this paper is therefore \(2.303\,RT\log c\) with the prefactor already set to 1 by the authors — so the prefactor is not a measurable quantity anywhere in the paper, and inverting footnote 16 returns the authors’ own fitted \(c\) rather than an estimate of it. Section 8 shows what can be measured in its place, and it is a genuine inconsistency.
Parameters and assumptions
Everything is pointwise algebra. There is no grid, no time step and no transport anywhere on this page, so items 7 and 8 of the page contract (axis refinement, boundary reads) have nothing to act on. The two systems that are solved — the polarization dipole ladder and the BET layer-occupancy ladder — are finite algebraic systems in a discrete layer index, not discretisations of a continuum, so “refining” them means adding layers, and both are swept over layer count in the Validation section for exactly that reason.
Units, as printed. Volumes adsorbed are cm³ at STP, per gram of adsorbent unless a figure says otherwise; energies are cal/mol; surfaces m²/g except Palmer and Clark’s, which the paper gives in cm²/g. \(R = 1.9872\) cal mol⁻¹ K⁻¹ and \(V_\mathrm{STP} = 22414\) cm³/mol are ours, not the paper’s — it prints neither.
Temperatures. Table I is at 90.1 K, stated. Elsewhere the paper prints Celsius, and −183 °C and −195.8 °C are converted with 273.16 K, giving 90.16 and 77.36 K; nothing on the page is sensitive at that level and the one place it could matter (the reconstruction of \(c\)) already carries a much larger admitted uncertainty.
The assumptions that carry the physics, all the paper’s:
- eq. (16), every layer above the first has the heat of liquefaction;
- eq. (17), and the same evaporation–condensation ratio;
- \(a_1\), \(b_1\) and \(E_1\) independent of how much is already in the first layer — which the authors themselves say fails below \(p/p_0 \approx 0.05\), “equation
- breaks down for the most active points on the surface”;
- for eq. (B), one single \(n\) for the whole surface — relaxed only in eq. (D), which is never evaluated.
Two reconstructions, both labelled as such wherever used.
- \(c\) from \(E_1-E_\mathrm{L}\). No table in the paper prints \(c\). Where this page needs \(c\) it inverts footnote 16 with the prefactor set to 1 — which is the same operation the authors performed in the other direction, since journal page 313 says the \(E\) column was obtained from \(c\). The inversion therefore recovers the authors’ own fitted \(c\), and the only thing lost is that the \(E\) column is printed as integers: \(\pm0.5\) cal at 90.1 K is \(\pm0.28\) % in \(c\). What the inversion does not do is make \(c\) a measured quantity — it is the authors’ fit, and section 8 shows the paper’s own two routes to one particular \(c\) disagreeing by a factor 2.24. Every conclusion drawn from a reconstructed \(c\) is checked for sensitivity across that factor, and section 8 reports which of them survives it and which does not.
- Molecular cross-sections. Tables III and V print \(v_\mathrm{m}\) and the surfaces derived from it, but the cross-sections themselves are in Emmett and Brunauer (1937), which is not on disk and was not consulted. They are recovered here by inverting the two columns, and the recovery is then checked across two independent tables.
What is deliberately not attempted. Fig. 6 (ethyl chloride on charcoal at three temperatures) is a fully specified eq. (E) prediction, but reproducing it needs the vapour pressure of ethyl chloride at −15.3, 0 and 20 °C, which the paper does not print; it is scoped out rather than closed with an outside correlation. The Darco statement (\(n = 2.2\) from \(x = 0.02\) to \(0.93\), no point off by 4 %) refers to an isotherm that appears nowhere in the paper, in a table or otherwise, and is likewise scoped out.
import sys, urllib.request
from pathlib import Path

if not any("shared" in p for p in sys.path):
    local = Path.cwd()
    for _ in range(5):
        if (local / "shared" / "gallery_utils.py").is_file():
            sys.path.insert(0, str(local / "shared")); break
        local = local.parent
    else:
        url = ("https://raw.githubusercontent.com/computational-chemical-engineering/"
               "pymrm-gallery/main/shared/gallery_utils.py")
        urllib.request.urlretrieve(url, "gallery_utils.py")
        sys.path.insert(0, ".")

import numpy as np
import pandas as pd
import sympy as sp
import matplotlib.pyplot as plt
from scipy.optimize import brentq
from pymrm import newton, NumJac
from gallery_utils import load_data, load_meta, cite_data, report_agreement

PAGE = "J1.3-bet-multimolecular-adsorption"
plt.rcParams.update({"figure.dpi": 110, "axes.grid": True, "grid.alpha": 0.3})
pd.set_option("display.width", 130)

R_CAL = 1.98720        # cal/(mol K)   -- ours; the paper prints no value
V_STP = 22414.0        # cm3/mol at STP -- ours
N_AV  = 6.02214076e23  # 1/mol          -- ours
T_TABLE1 = 90.1        # K, printed in the Table I heading
KELVIN = 273.16        # used only to convert the printed Celsius temperatures

np.random.seed(0)      # nothing here is stochastic; seeded so it stays that way
The data
Six files, all transcribed for this page from renders of the original at its native 300 ppi (pdfimages -list reports every page as CCITT-G4 bilevel at 300 ppi, so a larger render only interpolates), each numeric cropped and re-read at digit scale. The PDF’s text layer was not used for any digit. No other page’s dataset is loaded, so none of the cross-page reconciliation obligations apply here.
| file | what it is |
|---|---|
bet-1938-table1-nitrogen-90K.csv |
Table I — \(v_\mathrm{m}\), point B and \(E_1-E_\mathrm{L}\) for nitrogen at 90.1 K on twelve adsorbents |
bet-1938-table2-e1el-gases.csv |
Table II — \(E_1-E_\mathrm{L}\) for four gases on two adsorbents |
bet-1938-table3-silica-gel.csv |
Table III — seven gases on one silica gel, with both surface columns |
bet-1938-table4-so2-silica-gel.csv |
Table IV — SO₂ on silica gel at six temperatures (McGavack & Patrick’s isotherms) |
bet-1938-table5-charcoal.csv |
Table V — eight isotherms on charcoal |
bet-1938-printed-claims.csv |
every scalar in prose, in a footnote or in a figure’s constant block that this page checks |
Tier 6, and it matters here more than usual. Not one number in any of these tables is a measurement. Every entry is a constant the authors derived from an isotherm — \(v_\mathrm{m}\) and \(c\) from their own eq. (A) plot, point B read by eye, \(E_1-E_\mathrm{L}\) from \(c\) through footnote 16, the surface columns from \(v_\mathrm{m}\) and an external cross-section. Reproducing one of these numbers is reproduction, never validation, and the page says so at each such comparison.
Fit or test: the split this page keeps
| quantity | fitted to what | so agreement with it is |
|---|---|---|
| \(v_\mathrm{m}\), \(c\) | the isotherm itself, over \(0.05<p/p_0<0.35\) | a fit |
| the eq. (A) straight line inside that window | itself | a fit, and the page never reports it |
| \(n\) in eq. (B) | the isotherm above the window, by trial and error | a fit |
| \(E_1-E_\mathrm{L}\) | nothing further — a transform of \(c\) | the same fit, re-expressed |
| agreement of surface area between gases | nothing — cross-sections come from bulk densities | a test |
| point B against \(v_\mathrm{m}\) | nothing — point B is read off the raw isotherm | a test, but a weak one (§6) |
| \(v_\mathrm{m}(77.3\,\mathrm{K})\) predicted from the 90.1 K isotherm | nothing | a test |
| BET area against Palmer & Clark’s HF-dissolution area | nothing — a different measurement entirely | a test |
The single most important line in that table is the third-from-last. It is the reason this page exists in the form it does: the polarization theory can fit an isotherm, and cannot be asked any of the questions in the “test” rows, because it contains no \(v_\mathrm{m}\).
One residual risk in that row, stated rather than buried. That the cross-sections come from bulk densities rests on footnote 17 and on Emmett and Brunauer (1937), which is not on disk and was not consulted. If those cross-sections had in fact been adjusted to make the gases agree, the test would be circular. Three things bound that risk without the 1937 paper. The numbers recovered below are not round or tuned-looking (13.90, 12.88, 12.20, 13.79, 14.21, 32.23 Ų on solid packing). One single set reproduces two different adsorbents’ tables, which §5 verifies by recovering it from each independently. And — the only one of the three that is a number rather than an argument — §5 builds the worst case explicitly: a σ set tuned to flatten the silica-gel areas exactly, applied to charcoal, and the resulting spread compared with what the printed set achieves on the same rows. The bound it gives is a factor of about two, which is real but modest, and it is quoted with the basis it holds on; on the butane-inclusive basis the test has no power at all, which §5 also prints.
t1 = load_data("bet-1938-table1-nitrogen-90K.csv", page=PAGE)
t2 = load_data("bet-1938-table2-e1el-gases.csv", page=PAGE)
t3 = load_data("bet-1938-table3-silica-gel.csv", page=PAGE)
t4 = load_data("bet-1938-table4-so2-silica-gel.csv", page=PAGE)
t5 = load_data("bet-1938-table5-charcoal.csv", page=PAGE)
claims = load_data("bet-1938-printed-claims.csv", page=PAGE)
P = dict(zip(claims.key, claims.printed.astype(float)))

print(cite_data(load_meta("bet-1938-table1-nitrogen-90K.csv", page=PAGE)))
print(f"\nTable I ({len(t1)} rows) | Table II ({len(t2)}) | Table III ({len(t3)}) | "
      f"Table IV ({len(t4)}) | Table V ({len(t5)}) | printed claims ({len(claims)})")
display(t1)
Brunauer, S.; Emmett, P. H.; Teller, E. (1938) — Journal of the American Chemical Society 60(2) 309-319 (February 1938) — doi:10.1021/ja01269a023 — table
Table I (12 rows) | Table II (8) | Table III (7) | Table IV (6) | Table V (8) | printed claims (91)| row | substance | curve_fig1 | v_m_cc_per_g | point_B_cc_per_g | E1_minus_EL_cal_per_mol | |
|---|---|---|---|---|---|---|
| 0 | 1 | Unpromoted Fe catalyst 973I | NaN | 0.13 | 0.12 | 794 |
| 1 | 2 | Unpromoted Fe catalyst 973II | 1.0 | 0.29 | 0.27 | 774 |
| 2 | 3 | Fe-Al2O3 catalyst 954 | NaN | 2.86 | 2.78 | 894 |
| 3 | 4 | Fe-Al2O3 catalyst 424 | 2.0 | 2.23 | 2.09 | 774 |
| 4 | 5 | Fe-Al2O3-K2O catalyst 931 | NaN | 0.81 | 0.76 | 911 |
| 5 | 6 | Fe-Al2O3-K2O catalyst 958 | 3.0 | 0.56 | 0.55 | 854 |
| 6 | 7 | Fe-K2O catalyst 930 | NaN | 0.14 | 0.12 | 772 |
| 7 | 8 | Fused Cu catalyst | 4.0 | 0.05 | 0.05 | 776 |
| 8 | 9 | Commercial Cu catalyst | NaN | 0.09 | 0.10 | 834 |
| 9 | 10 | Cr2O3 gel | 5.0 | 53.30 | 50.50 | 738 |
| 10 | 11 | Cr2O3 glowed | NaN | 6.09 | 6.14 | 835 |
| 11 | 12 | Silica gel | 6.0 | 116.20 | 127.00 | 794 |
Five transcription checks the tables give for free
Table II’s silica-gel row repeats four values that also appear in Table III, and its catalyst-954 nitrogen entry also appears in Table I. Those five coincidences are not physics; they are a check that the transcription of three separate tables is mutually consistent, and they are the cheapest thing on this page.
xchk = []
for g, T in [("N2", -183), ("A", -183), ("CO2", -78), ("C4H10", 0)]:
    a = t2.loc[(t2.substance == "Silica gel") & (t2.gas == g), "E1_minus_EL_cal_per_mol"].item()
    b = t3.loc[(t3.gas == g) & (t3.temperature_C == T), "E1_minus_EL_cal_per_mol"].item()
    xchk.append(("Table II silica gel", f"Table III {g} at {T} C", a, b, a - b))
a = t2.loc[(t2.substance.str.contains("954")) & (t2.gas == "N2"), "E1_minus_EL_cal_per_mol"].item()
b = t1.loc[t1.substance == "Fe-Al2O3 catalyst 954", "E1_minus_EL_cal_per_mol"].item()
xchk.append(("Table II catalyst 954", "Table I catalyst 954", a, b, a - b))
xchk = pd.DataFrame(xchk, columns=["source A", "source B", "A", "B", "A-B"])
display(xchk)
TRANSCRIPTION_MAX_DEV = float(xchk["A-B"].abs().max())
print(f"worst disagreement across the five repeated cells: {TRANSCRIPTION_MAX_DEV:.0f} cal/mol")| source A | source B | A | B | A-B | |
|---|---|---|---|---|---|
| 0 | Table II silica gel | Table III N2 at -183 C | 794 | 794 | 0 |
| 1 | Table II silica gel | Table III A at -183 C | 594 | 594 | 0 |
| 2 | Table II silica gel | Table III CO2 at -78 C | 1335 | 1335 | 0 |
| 3 | Table II silica gel | Table III C4H10 at 0 C | 1930 | 1930 | 0 |
| 4 | Table II catalyst 954 | Table I catalyst 954 | 894 | 894 | 0 |
worst disagreement across the five repeated cells: 0 cal/molPyMRM implementation
Two algebraic ladders, and a set of root-finds. Nothing here is a PDE, and the page does not pretend otherwise — see What pymrm adds.
1. The BET layer-occupancy ladder (eqs. 10–12, 18–21). The closed forms (26) and (B) come from summing two geometric series. To get a route to \(v/v_\mathrm{m}\) that shares no algebra at all with them, the equilibria are solved as a system for the occupancies \(\{s_i\}\) and the two sums in eq. (15) are then formed term by term:
\[r_1 = s_1 - c\,x\,s_0, \qquad r_i = s_i - x\,s_{i-1}\;\;(i = 2\dots n), \qquad s_0 \equiv 1,\]
solved with newton and a NumJac((n, 1), axes_diagonals=[0]) Jacobian. The shape is (n, 1) and not (n,): with a bare 1-D shape NumJac treats the layer index as a field index and builds a dense \(n\times n\) Jacobian. axes_diagonals=[0] is correct here and is one of the rare cases where it is — the residual itself reads the neighbouring layer, which is exactly the condition the house rule names.
2. The polarization dipole ladder (eq. 1a). Same idea applied to the rival theory: instead of quoting its closed form (1b), the recursion \(\mu_i = k(\mu_{i-1}+\mu_{i+1})\) is assembled as a tridiagonal system with \(\mu_0 = 1\) and \(\mu_{N+1} = 0\) and solved directly. The decay ratio is then measured off the solution. For \(k \le 1/2\) this must reproduce (1b); for \(k > 1/2\) it must fail to settle on any ratio at all, and the page shows it doing so.
3. Root-finds, never sampled sweeps. The inflection point of eq. (26), the \(c\) at which the inflection value is largest, the \(c\) at which the paper’s single-point rule reaches exactly 5 % error, and the continuous \(n\) that reproduces a printed percentage — every one is a root-find. Two of them also have closed forms, derived symbolically here, and the closed form and the root-find are reported against each other.
# ---------------------------------------------------------------- BET forms
def v_over_vm_A(x, c):
    """eq. (26) = eq. (A) = eq. (B) at n -> infinity."""
    x = np.asarray(x, float)
    return c * x / ((1.0 - x) * (1.0 - x + c * x))

def v_eqB(x, c, n, vm=1.0):
    """eq. (B): at most n layers."""
    x = np.asarray(x, float)
    return (vm * c * x / (1.0 - x) * (1.0 - (n + 1) * x**n + n * x**(n + 1))
            / (1.0 + (c - 1.0) * x - c * x**(n + 1)))

def d2_numerator(x, c):
    """Sign-carrying numerator of d^2(v/v_m)/dx^2 for eq. (26)."""
    return -2.0 * c * ((c - 1.0)**2 * x**3 + 3.0 * (c - 1.0) * x - c + 2.0)

def x_inflection(c):
    """ROOT-FOUND, not sampled: the single inflection point of eq. (26) in (0,1).

    The cubic's value at x = 0 is (2 - c), so the isotherm is S-shaped -- has an
    inflection at all -- only for c > 2. Below that it is concave everywhere and
    there is no knee to read a point B off. NaN is returned there deliberately.
    """
    if c <= 2.0:
        return float("nan")
    return brentq(d2_numerator, 1e-13, 1.0 - 1e-13, args=(c,), xtol=1e-16, rtol=8.9e-16)

def inflection_ratio(c):
    xi = x_inflection(c)
    return float("nan") if not np.isfinite(xi) else float(v_over_vm_A(xi, c))

# --------------------------------- the layer ladder, solved rather than summed
def ladder_v_over_vm(x, c, n, tol=1e-14):
    """Solve eqs. (10)-(12) for the occupancies and form eq. (15)'s sums term by term.

    Shares no algebra with v_eqB: no geometric series is ever used.
    """
    jac = NumJac((n, 1), axes_diagonals=[0]) if n > 1 else NumJac((n, 1))
    def residual(s):
        r = np.empty_like(s)
        r[0, 0] = s[0, 0] - c * x * 1.0          # s_1 = c x s_0 with s_0 = 1  (eqs. 10, 18, 22)
        if n > 1:
            r[1:, 0] = s[1:, 0] - x * s[:-1, 0]  # s_i = x s_{i-1}             (eqs. 11, 12, 19)
        return r
    sol = newton(lambda s: jac(residual, s), np.full((n, 1), c * x), tol=tol, maxfev=50)
    s = sol.x.ravel()
    i = np.arange(1, n + 1)
    return float((i * s).sum() / (1.0 + s.sum())), sol

# ------------------------------- the polarization ladder, solved rather than quoted
def dipole_ladder(k, N):
    """mu_i = k (mu_{i-1} + mu_{i+1}), i = 1..N, with mu_0 = 1 and mu_{N+1} = 0."""
    A = np.zeros((N, N)); b = np.zeros(N)
    for i in range(N):
        A[i, i] = 1.0
        if i > 0:
            A[i, i - 1] = -k
        else:
            b[i] += k
        if i < N - 1:
            A[i, i + 1] = -k
    return np.linalg.solve(A, b)

def C_eq1b(k):
    """eq. (1b) -- real only for k <= 1/2."""
    disc = 1.0 - 4.0 * k * k
    return (1.0 - np.sqrt(disc)) / (2.0 * k) if disc >= 0.0 else np.nan

def C_eq1c(k):
    """eq. (1c), de Boer and Zwicker's approximation -- the one Bradley used."""
    return k / (1.0 - k * k)

print("forms defined: eq. (26)/(A), eq. (B), the layer ladder, the dipole ladder")
forms defined: eq. (26)/(A), eq. (B), the layer ladder, the dipole ladderResults
1. The rival theory, refuted on its own constants
The paper’s chain, reproduced input by input. Nothing here is fitted to anything: \(\alpha/r^3\) comes from a refractive index and a solid density, \(d\) comes from three lattice sums, and \(C\) follows.
Two by-products worth printing. Eq. (7) is not stated to follow from (5) and (6); it is checked symbolically that it does. And the paper never prints the density of solid argon it used — only the reference — so inverting eq. (7) against the printed \(\alpha/r^3 = 0.029\) says what density that was, which is a cheap test of whether the printed 0.029 is even self-consistent.
# --- eq. (7) follows from (5) and (6): symbolic, not asserted
n_ref, v_g, v_s = sp.symbols("n_ref v_g v_s", positive=True)
alpha_sym = (n_ref - 1) * v_g / (2 * sp.pi)               # eq. (5)
r3_sym    = sp.sqrt(2) * v_s                              # eq. (6)
EQ7_RESID = sp.simplify(alpha_sym / r3_sym
                        - (n_ref - 1) / (2**sp.Rational(3, 2) * sp.pi) * v_g / v_s)
print(f"eq. (7) from eqs. (5) and (6):  residual = {EQ7_RESID}  ->  identity: {EQ7_RESID == 0}")

# --- the printed chain
A_R3 = P["polar_alpha_over_r3"]
LATTICE_NET = P["polar_lattice_adj_quad"] - P["polar_lattice_adj_cube"]     # 8.357 - 8.823
D_CONST = LATTICE_NET / (1.0 + P["polar_lattice_self"] * A_R3)             # footnote 10
C_POL = D_CONST * A_R3                                                     # eq. (9)
K_POL = abs(C_POL)                                                         # k = 0.35 alpha/r^3
K1_POL = C_POL**2                                                          # eq. (4a)

chain = pd.DataFrame([
    ("8.357 - 8.823 -> the coefficient of (mu_i-1 + mu_i+1)", LATTICE_NET, -P["polar_net_adj"]),
    ("d = -0.466 / (1 + 11.1 alpha/r^3)",                     D_CONST,     P["polar_d"]),
    ("C = d (alpha/r^3)",                                     C_POL,       P["polar_C"]),
    ("K1 = C^2",                                              K1_POL,      P["polar_K1"]),
], columns=["step", "recomputed", "printed"])
display(chain)

# --- what density of solid argon the printed 0.029 implies
VG_OVER_VS = A_R3 * 2**1.5 * np.pi / P["polar_n_minus_1"]
V_SOLID = V_STP / VG_OVER_VS
RHO_SOLID = 39.948 / V_SOLID
R_NN = (np.sqrt(2.0) * V_SOLID / N_AV)**(1.0 / 3.0) * 1e8
print(f"\ninverting eq. (7) against the printed alpha/r^3 = {A_R3}:")
print(f"  v_g/v_s = {VG_OVER_VS:.4f}  ->  molar volume of solid argon {V_SOLID:.3f} cm3/mol")
print(f"  -> density {RHO_SOLID:.4f} g/cm3, nearest-neighbour distance {R_NN:.4f} Angstrom")
print("  (both are recovered, not printed; the paper cites Int. Crit. Tables I p. 103,")
print("   which is NOT on disk and was not consulted. They are stated here as the")
print("   inputs the printed 0.029 implies, and they are physically ordinary ones.)")
eq. (7) from eqs. (5) and (6): residual = 0 -> identity: True| step | recomputed | printed | |
|---|---|---|---|
| 0 | 8.357 - 8.823 -> the coefficient of (mu_i-1 + ... | -0.466000 | -0.4660 |
| 1 | d = -0.466 / (1 + 11.1 alpha/r^3) | -0.352523 | -0.3500 |
| 2 | C = d (alpha/r^3) | -0.010223 | -0.0100 |
| 3 | K1 = C^2 | 0.000105 | 0.0001 |
inverting eq. (7) against the printed alpha/r^3 = 0.029:
  v_g/v_s = 926.9324  ->  molar volume of solid argon 24.181 cm3/mol
  -> density 1.6521 g/cm3, nearest-neighbour distance 3.8437 Angstrom
  (both are recovered, not printed; the paper cites Int. Crit. Tables I p. 103,
   which is NOT on disk and was not consulted. They are stated here as the
   inputs the printed 0.029 implies, and they are physically ordinary ones.)
A printed grouping that does not parse, proved from the paper’s own arithmetic. Footnote 10 sets the adjacent-layer lattice sum as (8.357 - 8.823/r^3). As printed that is dimensionally inconsistent — a pure number minus a number over \(r^3\) — and it does not produce the coefficient used two lines later. The intended grouping is \((8.357-8.823)/r^3\), and the cell above shows \(8.357-8.823\) is exactly \(-0.466\), which is exactly the coefficient of the next display. Reported, not repaired, and the CSV stores the two lattice sums and the 0.466 as separate keys so the misprint can be proved rather than asserted.
The comparison the whole refutation turns on
Bradley obtained \(k\) by fitting, and used eq. (1c) to turn it into \(C\). Compare that \(C\) with the one just computed.
k_brad = P["bradley_k_Al2SO4"]
C_BRAD = C_eq1c(k_brad)
C_FACTOR = C_BRAD / abs(C_POL)
E_FACTOR = C_FACTOR**2                       # binding energy goes as C^2, eq. (2)
K_LIMIT_RATIO = k_brad / P["bradley_k_upper_limit"]
K_ADMISSIBLE = brentq(lambda kk: C_eq1c(kk) - abs(C_POL), 1e-12, 0.49999, xtol=1e-16)

cmp = pd.DataFrame([
    ("computed from the polarizability (eqs. 5-9)", K_POL,  abs(C_POL), K_POL**2),
    ("Bradley's fit, CuSO4 (eq. 1c)", P["bradley_k_CuSO4"], C_eq1c(P["bradley_k_CuSO4"]),
     C_eq1c(P["bradley_k_CuSO4"])**2),
    ("Bradley's fit, Al2(SO4)3 (eq. 1c)", k_brad, C_BRAD, C_BRAD**2),
], columns=["source of k", "k", "|C|", "C^2 = K1  (energy ratio per layer)"])
display(cmp)

print(f"C from Bradley's k = {k_brad} is {C_BRAD:.6f}; the paper prints {P['bradley_C_implied']:g}")
print(f"factor in the dipole ratio C  : {C_FACTOR:.4f}")
print(f"factor in the energy ratio C^2: {E_FACTOR:.1f}")
print(f"\nk that eq. (1c) needs to give the COMPUTED |C|: {K_ADMISSIBLE:.8f}")
print(f"  Bradley's k is {k_brad / K_ADMISSIBLE:.2f} times larger.")
print(f"\nand eq. (1b) is real only for k <= {P['bradley_k_upper_limit']:g}:")
print(f"  Bradley's two k exceed that limit by "
      f"{(P['bradley_k_CuSO4']/P['bradley_k_upper_limit']-1)*100:.1f} % and "
      f"{(K_LIMIT_RATIO-1)*100:.1f} %; 1 - 4k^2 = "
f"{1-4*P['bradley_k_CuSO4']**2:+.4f} and {1-4*k_brad**2:+.4f}")| source of k | k | |C| | C^2 = K1 (energy ratio per layer) | |
|---|---|---|---|---|
| 0 | computed from the polarizability (eqs. 5-9) | 0.010223 | 0.010223 | 0.000105 |
| 1 | Bradley's fit, CuSO4 (eq. 1c) | 0.607500 | 0.962843 | 0.927067 |
| 2 | Bradley's fit, Al2(SO4)3 (eq. 1c) | 0.615000 | 0.989104 | 0.978326 |
C from Bradley's k = 0.615 is 0.989104; the paper prints 0.99
factor in the dipole ratio C  : 96.7512
factor in the energy ratio C^2: 9360.8

k that eq. (1c) needs to give the COMPUTED |C|: 0.01022210
  Bradley's k is 60.16 times larger.

and eq. (1b) is real only for k <= 0.5:
  Bradley's two k exceed that limit by 21.5 % and 23.0 %; 1 - 4k^2 = -0.4762 and -0.5129
2. The same conclusion without eq. (1b): solve the recursion
Everything above rests on closed forms — (1b) and (1c) — that the paper quotes. A closed form quoted from a rival’s paper is exactly the kind of thing that should not be load-bearing, so the recursion (1a) itself is assembled and solved here, and the decay ratio measured off the solution.
For \(k \le 1/2\) this must return eq. (1b). For \(k > 1/2\) the recursion has no decaying solution, so there is nothing for it to return, and what it does instead is the interesting part: the answer depends on where the ladder is truncated, and the moments change sign along it. That is the strongest statement the page makes against Bradley’s \(k\), and it needs neither (1b) nor (1c).
N_LADDER = 400
mu_phys = dipole_ladder(K_POL, N_LADDER)
LADDER_C = float(mu_phys[0])
LADDER_VS_1B = abs(LADDER_C / C_eq1b(K_POL) - 1.0)
print(f"physical k = {K_POL:.8f}")
print(f"  measured mu_1/mu_0     = {LADDER_C:.12f}")
print(f"  eq. (1b)               = {C_eq1b(K_POL):.12f}   relative deviation {LADDER_VS_1B:.3e}")
print(f"  geometric? mu_2/mu_1   = {mu_phys[1]/mu_phys[0]:.12f}")
print(f"  and k ~ C to within k^2: |C/k - 1| = {abs(C_eq1b(K_POL)/K_POL - 1):.4e}, "
      f"k^2 = {K_POL**2:.4e}")

rows = []
for N in (100, 200, 300, 400, 500, 600):
    rows.append((N, dipole_ladder(K_POL, N)[0], dipole_ladder(k_brad, N)[0]))
trunc = pd.DataFrame(rows, columns=["layers N", "mu_1/mu_0 at the physical k", "mu_1/mu_0 at Bradley's k"])
display(trunc)
LADDER_SPREAD_PHYS = float(np.ptp(trunc.iloc[:, 1]) / abs(np.mean(trunc.iloc[:, 1])))
LADDER_SPREAD_BRAD = float(np.ptp(trunc.iloc[:, 2]) / abs(np.mean(trunc.iloc[:, 2])))
print(f"relative spread over N:  physical k {LADDER_SPREAD_PHYS:.3e}   Bradley's k {LADDER_SPREAD_BRAD:.4f}")
sgn = np.sign(dipole_ladder(k_brad, N_LADDER)[:8]).astype(int).tolist()
print(f"sign of mu_1..mu_8 at Bradley's k: {sgn}  -- an oscillation, not a decaying film")
physical k = 0.01022316
measured mu_1/mu_0 = 0.010224232306
eq. (1b) = 0.010224232306 relative deviation 8.504e-14
geometric? mu_2/mu_1 = 0.010224232306
and k ~ C to within k^2: |C/k - 1| = 1.0453e-04, k^2 = 1.0451e-04| layers N | mu_1/mu_0 at the physical k | mu_1/mu_0 at Bradley's k | |
|---|---|---|---|
| 0 | 100 | 0.010224 | 10.389639 |
| 1 | 200 | 0.010224 | 1.446921 |
| 2 | 300 | 0.010224 | 0.898406 |
| 3 | 400 | 0.010224 | 0.466682 |
| 4 | 500 | 0.010224 | -0.772304 |
| 5 | 600 | 0.010224 | 2.511583 |
relative spread over N:  physical k 0.000e+00   Bradley's k 4.4824
sign of mu_1..mu_8 at Bradley's k: [1, -1, -1, -1, -1, -1, 1, 1]  -- an oscillation, not a decaying film
fig, ax = plt.subplots(1, 2, figsize=(10.5, 3.9))
i = np.arange(1, 21)
ax[0].semilogy(i, np.abs(dipole_ladder(K_POL, N_LADDER)[:20]), "o-", ms=4,
label=f"computed k = {K_POL:.5f}")
ax[0].semilogy(i, np.abs(C_eq1b(K_POL)**i), "k--", lw=1, label="eq. (1b): $C^i$")
ax[0].set(xlabel="layer $i$", ylabel=r"$|\mu_i / \mu_0|$",
title="Polarization ladder at the computed $k$")
ax[0].legend(fontsize=8)
ax[1].plot(i, dipole_ladder(k_brad, N_LADDER)[:20], "s-", ms=4, color="C3",
label=f"Bradley's k = {k_brad}")
ax[1].axhline(0, color="k", lw=0.8)
ax[1].set(xlabel="layer $i$", ylabel=r"$\mu_i / \mu_0$",
title="Polarization ladder at Bradley's $k$ (no decaying solution)")
ax[1].legend(fontsize=8)
fig.tight_layout(); plt.show()
print("Left: at the k the polarizability gives, the ladder decays geometrically and the")
print(" measured ratio is eq. (1b) to 12 figures. Right: at Bradley's k it oscillates,")
print(" changes sign, and depends on where the ladder is cut off.")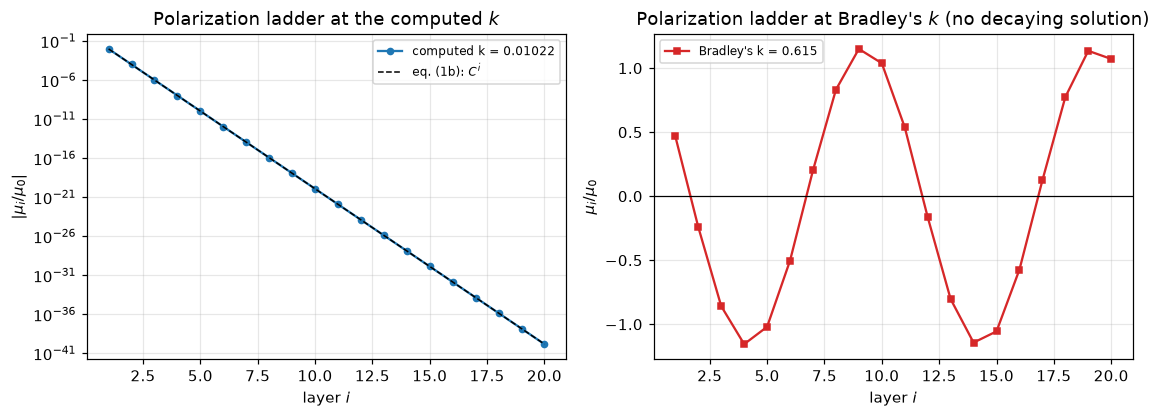
Left: at the k the polarizability gives, the ladder decays geometrically and the
      measured ratio is eq. (1b) to 12 figures. Right: at Bradley's k it oscillates,
      changes sign, and depends on where the ladder is cut off.
What this does and does not establish. It establishes that the polarization theory as Brunauer, Emmett and Teller restate it cannot carry the binding energy Bradley’s fit assigns it, using only inputs the paper prints. It does not establish anything about de Boer, Zwicker or Bradley’s own papers: none of the three is on disk and none was consulted. The rival is being judged in the form its opponent gives it, and that limitation is real. What makes the judgement worth something anyway is that the inputs — a refractive index, a solid density, three lattice sums — are checkable physics rather than assertions, and two of them are reproduced above from independent directions.
3. The BET algebra: five identities, checked symbolically
Every step from the layer equilibria to the lettered equations. These are identities, they are exactly zero, and the page treats them as transcription checks and nothing more — a wrong exponent anywhere would show up here, and nothing else on this page would notice.
x, c, n, vm, p, p0 = sp.symbols("x c n v_m p p_0", positive=True)
eq26 = c * x / ((1 - x) * (1 - x + c * x))
eqB  = c * x / (1 - x) * (1 - (n + 1) * x**n + n * x**(n + 1)) / (1 + (c - 1) * x - c * x**(n + 1))
eq28 = vm * c * p / ((p0 - p) * (1 + (c - 1) * (p / p0)))

ident = []
ident.append(("(28) rearranges to (A)",
              sp.simplify(p / (eq28 * (p0 - p)) - (1 / (vm * c) + (c - 1) / (vm * c) * p / p0))))
ident.append(("(B) at n -> infinity is (26)",
              sp.simplify(eqB.subs({x**n: 0, x**(n + 1): 0}) - eq26)))
ident.append(("(B) at n = 1 is the Langmuir form",
              sp.simplify(eqB.subs(n, 1) - c * x / (1 + c * x))))
v_n1 = (vm * eqB.subs(n, 1)).subs(x, p / p0)
ident.append(("(B) at n = 1 rearranges to (E)",
              sp.simplify(p / v_n1 - (p0 / (c * vm) + p / vm))))
ident.append(("(7) follows from (5) and (6)", EQ7_RESID))
ident = pd.DataFrame(ident, columns=["identity", "residual"])
display(ident)
SYMBOLIC_MAX_RESID = float(max(abs(float(r)) for r in ident.residual))
print(f"largest symbolic residual: {SYMBOLIC_MAX_RESID:g} (exactly zero -- these are identities)")| identity | residual | |
|---|---|---|
| 0 | (28) rearranges to (A) | 0 |
| 1 | (B) at n -> infinity is (26) | 0 |
| 2 | (B) at n = 1 is the Langmuir form | 0 |
| 3 | (B) at n = 1 rearranges to (E) | 0 |
| 4 | (7) follows from (5) and (6) | 0 |
largest symbolic residual: 0 (exactly zero -- these are identities)4. Eq. (B) on every branch, and the two percentages the paper prints
The identities above are worthless as a check on the numbers, so eq. (B) is now evaluated the hard way: the layer equilibria (10)–(12) are solved for the occupancies and eq. (15)’s two sums formed term by term, with no geometric series anywhere. Exercised on every branch the paper uses — \(n = 1\) (charcoal), \(n = 2\) (Darco, quoted), \(n = 5,6,7\) (Fig. 3), \(n = 3.5\) is non-integer and belongs to Table IV, and \(n \to \infty\) (eq. A) — and at four relative pressures, two inside the fitting window and two outside it.
Then the printed claim itself. Journal page 316: with \(n = 6\) against the \(n\) that actually fits, “the theoretical curve will be in error to the extent of \(+5\%\) at \(x = 0.58\), and \(-7\%\) at \(x = 0.72\)”. Fig. 3 prints \(v_\mathrm{m}\) and \(c\) for that very isotherm, so both percentages are computable.
rows = []
for nn in (1, 2, 5, 6, 7, 20, 60):
    for xx in (0.05, 0.30, 0.58, 0.72):
        lad, sol = ladder_v_over_vm(xx, P["fig3_c"], nn)
        cf = float(v_eqB(xx, P["fig3_c"], nn))
        rows.append((nn, xx, lad, cf, abs(lad / cf - 1), sol.nit, bool(sol.success)))
branch = pd.DataFrame(rows, columns=["n", "x", "ladder solve", "eq. (B) closed form",
                                     "rel. dev.", "Newton its", "converged"])
display(branch.round({"ladder solve": 9, "eq. (B) closed form": 9}))
LADDER_VS_EQB = float(branch["rel. dev."].max())
LADDER_ALL_CONVERGED = bool(branch.converged.all())
print(f"worst relative deviation over 28 (n, x) pairs: {LADDER_VS_EQB:.3e}; "
      f"all Newton solves converged: {LADDER_ALL_CONVERGED}")

# eq. (A) as the large-n limit -- the paper's own claim, quantified
print("\nthe paper: \"when x has a small value, and n is as large as 4 or 5, equation (A)")
print("becomes a very good approximation to (B)\".  Measured, with Fig. 3's c:")
for xx in (0.05, 0.35, 0.58, 0.72):
    for nn in (4, 5, 6):
        rel = float(v_eqB(xx, P["fig3_c"], nn) / v_over_vm_A(xx, P["fig3_c"]) - 1) * 100
print(f" x = {xx:<5} n = {nn}: eq.(B)/eq.(A) - 1 = {rel:+9.4f} %")| n | x | ladder solve | eq. (B) closed form | rel. dev. | Newton its | converged | |
|---|---|---|---|---|---|---|---|
| 0 | 1 | 0.05 | 0.886814 | 0.886814 | 1.110223e-16 | 1 | True |
| 1 | 1 | 0.30 | 0.979171 | 0.979171 | 2.220446e-16 | 1 | True |
| 2 | 1 | 0.58 | 0.989117 | 0.989117 | 3.330669e-16 | 1 | True |
| 3 | 1 | 0.72 | 0.991215 | 0.991215 | 3.330669e-16 | 1 | True |
| 4 | 2 | 0.05 | 0.934078 | 0.934078 | 2.220446e-16 | 2 | True |
| 5 | 2 | 0.30 | 1.210954 | 1.210954 | 2.220446e-16 | 2 | True |
| 6 | 2 | 0.58 | 1.357634 | 1.357634 | 0.000000e+00 | 2 | True |
| 7 | 2 | 0.72 | 1.411332 | 1.411332 | 1.110223e-16 | 2 | True |
| 8 | 5 | 0.05 | 0.938800 | 0.938800 | 1.110223e-16 | 3 | True |
| 9 | 5 | 0.30 | 1.395561 | 1.395561 | 4.440892e-16 | 3 | True |
| 10 | 5 | 0.58 | 2.019731 | 2.019731 | 0.000000e+00 | 3 | True |
| 11 | 5 | 0.72 | 2.364588 | 2.364588 | 2.220446e-16 | 3 | True |
| 12 | 6 | 0.05 | 0.938801 | 0.938801 | 3.330669e-16 | 3 | True |
| 13 | 6 | 0.30 | 1.403283 | 1.403283 | 6.661338e-16 | 3 | True |
| 14 | 6 | 0.58 | 2.133252 | 2.133252 | 0.000000e+00 | 3 | True |
| 15 | 6 | 0.72 | 2.592768 | 2.592768 | 2.220446e-16 | 3 | True |
| 16 | 7 | 0.05 | 0.938801 | 0.938801 | 0.000000e+00 | 3 | True |
| 17 | 7 | 0.30 | 1.406098 | 1.406098 | 6.661338e-16 | 3 | True |
| 18 | 7 | 0.58 | 2.212449 | 2.212449 | 0.000000e+00 | 3 | True |
| 19 | 7 | 0.72 | 2.783327 | 2.783327 | 2.220446e-16 | 3 | True |
| 20 | 20 | 0.05 | 0.938801 | 0.938801 | 2.220446e-16 | 3 | True |
| 21 | 20 | 0.30 | 1.407611 | 1.407611 | 1.110223e-16 | 3 | True |
| 22 | 20 | 0.58 | 2.369631 | 2.369631 | 2.220446e-16 | 3 | True |
| 23 | 20 | 0.72 | 3.534571 | 3.534571 | 2.220446e-16 | 3 | True |
| 24 | 60 | 0.05 | 0.938801 | 0.938801 | 2.220446e-16 | 3 | True |
| 25 | 60 | 0.30 | 1.407611 | 1.407611 | 1.110223e-16 | 3 | True |
| 26 | 60 | 0.58 | 2.370000 | 2.370000 | 2.220446e-16 | 3 | True |
| 27 | 60 | 0.72 | 3.562587 | 3.562587 | 1.110223e-16 | 3 | True |
worst relative deviation over 28 (n, x) pairs: 6.661e-16; all Newton solves converged: True

the paper: "when x has a small value, and n is as large as 4 or 5, equation (A)
becomes a very good approximation to (B)".  Measured, with Fig. 3's c:
   x = 0.05  n = 4:  eq.(B)/eq.(A) - 1 =   -0.0024 %
   x = 0.05  n = 5:  eq.(B)/eq.(A) - 1 =   -0.0002 %
   x = 0.05  n = 6:  eq.(B)/eq.(A) - 1 =   -0.0000 %
   x = 0.35  n = 4:  eq.(B)/eq.(A) - 1 =   -3.9782 %
   x = 0.35  n = 5:  eq.(B)/eq.(A) - 1 =   -1.7221 %
   x = 0.35  n = 6:  eq.(B)/eq.(A) - 1 =   -0.7204 %
   x = 0.58  n = 4:  eq.(B)/eq.(A) - 1 =  -21.4838 %
   x = 0.58  n = 5:  eq.(B)/eq.(A) - 1 =  -14.7793 %
   x = 0.58  n = 6:  eq.(B)/eq.(A) - 1 =   -9.9894 %
   x = 0.72  n = 4:  eq.(B)/eq.(A) - 1 =  -41.2135 %
   x = 0.72  n = 5:  eq.(B)/eq.(A) - 1 =  -33.6272 %
   x = 0.72  n = 6:  eq.(B)/eq.(A) - 1 =  -27.2223 %
VM3, C3 = P["fig3_vm"], P["fig3_c"]
ERR_058 = float(v_eqB(P["eqB_x_n5"], C3, 6, VM3) / v_eqB(P["eqB_x_n5"], C3, 5, VM3) - 1) * 100
ERR_072 = float(v_eqB(P["eqB_x_n7"], C3, 6, VM3) / v_eqB(P["eqB_x_n7"], C3, 7, VM3) - 1) * 100
pr = pd.DataFrame([
(P["eqB_x_n5"], "n = 6 against n = 5", v_eqB(P["eqB_x_n5"], C3, 5, VM3),
v_eqB(P["eqB_x_n5"], C3, 6, VM3), ERR_058, P["eqB_err_at_058"]),
(P["eqB_x_n7"], "n = 6 against n = 7", v_eqB(P["eqB_x_n7"], C3, 7, VM3),
v_eqB(P["eqB_x_n7"], C3, 6, VM3), ERR_072, P["eqB_err_at_072"]),
], columns=["x", "comparison", "reference v (cc)", "n = 6 v (cc)", "recomputed %", "printed %"])
display(pr.round(4))
# the continuous n each printed percentage implies -- a pymrm Newton root-find
def n_for_target(xx, cc, target, n0):
jac = NumJac((1, 1))
res = lambda nn: np.atleast_2d(float(v_eqB(xx, cc, float(nn.ravel()[0]), 1.0)) - target)
sol = newton(lambda nn: jac(res, nn), np.array([[float(n0)]]), tol=1e-13, maxfev=80)
return float(sol.x.ravel()[0]), bool(sol.success)
N_FROM_058, ok1 = n_for_target(P["eqB_x_n5"], C3,
1.05 * float(v_eqB(P["eqB_x_n5"], C3, 5, 1.0)), 6.0)
N_FROM_072, ok2 = n_for_target(P["eqB_x_n7"], C3,
0.93 * float(v_eqB(P["eqB_x_n7"], C3, 7, 1.0)), 6.0)
print(f"n giving exactly +5 % over the n = 5 curve at x = 0.58 : {N_FROM_058:.5f} (converged {ok1})")
print(f"n giving exactly -7 % under the n = 7 curve at x = 0.72: {N_FROM_072:.5f} (converged {ok2})")
print(f"the two printed percentages are mutually consistent with a single n in "
f"[{min(N_FROM_058, N_FROM_072):.3f}, {max(N_FROM_058, N_FROM_072):.3f}], i.e. the paper's")
print(f"'average value of n = 6' is right to {max(abs(N_FROM_058/6-1), abs(N_FROM_072/6-1))*100:.2f} %.")
print("Non-integer n is the paper's own device, not ours: Table IV's footer reads n = 3.5.")| x | comparison | reference v (cc) | n = 6 v (cc) | recomputed % | printed % | |
|---|---|---|---|---|---|---|
| 0 | 0.58 | n = 6 against n = 5 | 268.6243 | 283.7226 | 5.6206 | 5.0 |
| 1 | 0.72 | n = 6 against n = 7 | 370.1825 | 344.8382 | -6.8464 | -7.0 |
n giving exactly +5 % over the n = 5 curve at x = 0.58 : 5.87064  (converged True)
n giving exactly -7 % under the n = 7 curve at x = 0.72: 5.97955  (converged True)
the two printed percentages are mutually consistent with a single n in [5.871, 5.980], i.e. the paper's
'average value of n = 6' is right to 2.16 %.
Non-integer n is the paper's own device, not ours: Table IV's footer reads n = 3.5.
xs = np.linspace(0.02, 0.80, 400)
fig, ax = plt.subplots(figsize=(6.6, 4.2))
for nn, ls in [(1, ":"), (5, "-"), (6, "-"), (7, "-")]:
ax.plot(xs, v_eqB(xs, C3, nn, VM3), ls, lw=1.5, label=f"eq. (B), n = {nn}")
ax.plot(xs, v_over_vm_A(xs, C3) * VM3, "k--", lw=1.2, label=r"eq. (A), $n\to\infty$")
ax.axhline(VM3, color="0.5", lw=0.8)
ax.text(0.03, VM3 * 1.03, "$v_m$", fontsize=8, color="0.4")
for xx in (P["eqB_x_n5"], P["eqB_x_n7"]):
ax.axvline(xx, color="0.75", lw=0.8, ls="-.")
ax.set(xlabel="$p/p_0$", ylabel="v adsorbed, cm$^3$ STP", ylim=(0, 520),
title=f"Eq. (B) on its branches, at Fig. 3's own constants\n$v_m$ = {VM3} cc, c = {C3}")
ax.legend(fontsize=8, loc="upper left"); fig.tight_layout(); plt.show()
print("Constants from the typeset block inside the Fig. 3 frame. NO CURVE IS DIGITISED:")
print("this is eq. (B) evaluated, not the paper's drawing traced.")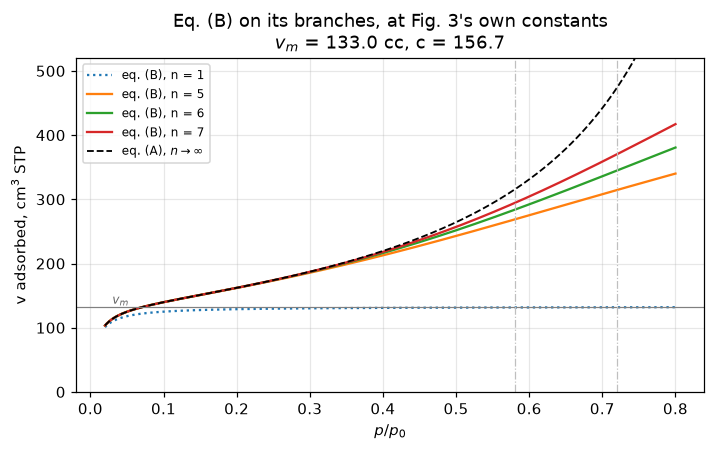
Constants from the typeset block inside the Fig. 3 frame. NO CURVE IS DIGITISED:
this is eq. (B) evaluated, not the paper's drawing traced.
5. The evidence that is not a fit
\(v_\mathrm{m}\) is fitted, once per isotherm. What is not fitted is that seven different gases must give the same surface. Turning \(v_\mathrm{m}\) into an area needs a cross-sectional area per molecule, and those come from the density of the solidified and of the liquefied gas — bulk properties, with no adsorption in them. Nothing was adjusted to make the seven agree.
First, recover the cross-sections and check them across two tables. Tables III and V were computed with the same set, so inverting each independently must return the same numbers. This also fixes something the page would otherwise have to take on faith: Emmett and Brunauer (1937), where the cross-sections are tabulated, is not on disk and was not consulted.
def sigma_A2(vm_ccg, S_m2g):
    """Cross-section per molecule implied by a v_m and a specific surface, in Angstrom^2."""
    return S_m2g * 1e4 / (np.asarray(vm_ccg, float) / V_STP * N_AV) * 1e16

s3 = t3.assign(sig_solid=sigma_A2(t3.v_m_cc_per_g, t3.surface_solid_m2_per_g),
               sig_liquid=sigma_A2(t3.v_m_cc_per_g, t3.surface_liquid_m2_per_g))
s5 = t5.assign(sig_solid=sigma_A2(t5.v_m_cc_per_g, t5.surface_solid_m2_per_g),
               sig_liquid=sigma_A2(t5.v_m_cc_per_g, t5.surface_liquid_m2_per_g))
mg = s3.merge(s5, on=["gas", "temperature_C"], suffixes=("_silica", "_charcoal"))
mg["dev_solid_%"] = (mg.sig_solid_silica / mg.sig_solid_charcoal - 1).abs() * 100
mg["dev_liquid_%"] = (mg.sig_liquid_silica / mg.sig_liquid_charcoal - 1).abs() * 100
display(mg[["gas", "temperature_C", "sig_solid_silica", "sig_solid_charcoal", "dev_solid_%",
            "sig_liquid_silica", "sig_liquid_charcoal", "dev_liquid_%"]].round(4))
SIGMA_CROSS_MAX = float(max(mg["dev_solid_%"].max(), mg["dev_liquid_%"].max()))

# What CAN rounding produce? V_STP and N_A cancel in the ratio of two sigma, so the
# envelope is fixed entirely by the printed quantisation: surfaces are integers
# (+- 0.5), v_m carries one decimal (+- 0.05). Nothing to converge, nothing assumed.
def rounding_envelope(vm_a, S_a, vm_b, S_b):
    return (0.5 / S_a + 0.05 / vm_a + 0.5 / S_b + 0.05 / vm_b) * 100
mg["env_solid_%"] = rounding_envelope(mg.v_m_cc_per_g_silica, mg.surface_solid_m2_per_g_silica,
                                      mg.v_m_cc_per_g_charcoal, mg.surface_solid_m2_per_g_charcoal)
mg["env_liquid_%"] = rounding_envelope(mg.v_m_cc_per_g_silica, mg.surface_liquid_m2_per_g_silica,
                                       mg.v_m_cc_per_g_charcoal, mg.surface_liquid_m2_per_g_charcoal)
mg["over_solid"] = mg["dev_solid_%"] / mg["env_solid_%"]
mg["over_liquid"] = mg["dev_liquid_%"] / mg["env_liquid_%"]
SIGMA_OVER_ENVELOPE = float(max(mg["over_solid"].max(), mg["over_liquid"].max()))
n_over = int((mg["over_solid"] > 1).sum() + (mg["over_liquid"] > 1).sum())
SIG_WORST_ROW = mg.loc[mg["over_liquid"].idxmax()]
display(mg[["gas", "temperature_C", "dev_solid_%", "env_solid_%", "over_solid",
            "dev_liquid_%", "env_liquid_%", "over_liquid"]].round(4))
print(f"{len(mg)} isotherms are shared between Tables III and V, giving {2*len(mg)} independent")
print(f"pairs of recovered cross-sections. Worst disagreement: {SIGMA_CROSS_MAX:.4f} %.")
print("\nIS THAT THE ROUNDING? Mostly, but NOT on the row that sets the maximum -- and the")
print("page does not attribute it to rounding, because the arithmetic says it cannot be.")
print(f"  {2*len(mg)-n_over} of the {2*len(mg)} pairs sit inside their own rounding envelope.")
print(f"  {n_over} does not: {SIG_WORST_ROW.gas} at {SIG_WORST_ROW.temperature_C:g} C, "
      f"liquid packing --")
print(f"    {SIG_WORST_ROW['dev_liquid_%']:.4f} % observed against a "
      f"{SIG_WORST_ROW['env_liquid_%']:.4f} % envelope,")
print(f"    a factor {SIG_WORST_ROW['over_liquid']:.4f}. All four inputs "
      f"({SIG_WORST_ROW.v_m_cc_per_g_silica:g}, "
      f"{SIG_WORST_ROW.surface_liquid_m2_per_g_silica:.0f}, "
      f"{SIG_WORST_ROW.v_m_cc_per_g_charcoal:g}, "
      f"{SIG_WORST_ROW.surface_liquid_m2_per_g_charcoal:.0f})")
print("    were re-read at digit scale; this is in the paper, not in the CSV. CAUSE UNKNOWN,")
print("    reported and not repaired. Counted with the printed defects of section 9.")
print("\nWhat the check still establishes: the two tables were computed with ONE set of")
print("cross-sections, and this page now has that set without the 1937 paper.")| gas | temperature_C | sig_solid_silica | sig_solid_charcoal | dev_solid_% | sig_liquid_silica | sig_liquid_charcoal | dev_liquid_% | |
|---|---|---|---|---|---|---|---|---|
| 0 | N2 | -195.8 | 13.8809 | 13.8829 | 0.0148 | 16.2962 | 16.3027 | 0.0398 |
| 1 | N2 | -183.0 | 13.9012 | 13.8981 | 0.0224 | 17.1042 | 17.1037 | 0.0032 |
| 2 | A | -183.0 | 12.8848 | 12.8843 | 0.0042 | 14.4759 | 14.4905 | 0.1006 |
| 3 | O2 | -183.0 | 12.1982 | 12.1685 | 0.2442 | 14.1915 | 14.1833 | 0.0579 |
| 4 | CO | -183.0 | 13.7883 | 13.7888 | 0.0031 | 16.8900 | 17.0027 | 0.6631 |
| 5 | CO2 | -78.0 | 14.2110 | 14.1855 | 0.1800 | 17.1059 | 17.1149 | 0.0527 |
| 6 | C4H10 | 0.0 | 32.2312 | 32.1977 | 0.1040 | 32.2312 | 32.2567 | 0.0793 |
| gas | temperature_C | dev_solid_% | env_solid_% | over_solid | dev_liquid_% | env_liquid_% | over_liquid | |
|---|---|---|---|---|---|---|---|---|
| 0 | N2 | -195.8 | 0.0148 | 0.2453 | 0.0603 | 0.0398 | 0.2188 | 0.1820 |
| 1 | N2 | -183.0 | 0.0224 | 0.2645 | 0.0846 | 0.0032 | 0.2285 | 0.0142 |
| 2 | A | -183.0 | 0.0042 | 0.2532 | 0.0164 | 0.1006 | 0.2325 | 0.4328 |
| 3 | O2 | -183.0 | 0.2442 | 0.2484 | 0.9829 | 0.0579 | 0.2220 | 0.2610 |
| 4 | CO | -183.0 | 0.0031 | 0.2557 | 0.0121 | 0.6631 | 0.2210 | 3.0005 |
| 5 | CO2 | -78.0 | 0.1800 | 0.2805 | 0.6419 | 0.0527 | 0.2460 | 0.2142 |
| 6 | C4H10 | 0.0 | 0.1040 | 0.3562 | 0.2921 | 0.0793 | 0.3561 | 0.2227 |
7 isotherms are shared between Tables III and V, giving 14 independent
pairs of recovered cross-sections. Worst disagreement: 0.6631 %.

IS THAT THE ROUNDING? Mostly, but NOT on the row that sets the maximum -- and the
page does not attribute it to rounding, because the arithmetic says it cannot be.
  13 of the 14 pairs sit inside their own rounding envelope.
  1 does not: CO at -183 C, liquid packing --
    0.6631 % observed against a 0.2210 % envelope,
    a factor 3.0005. All four inputs (121.2, 550, 179.5, 820)
    were re-read at digit scale; this is in the paper, not in the CSV. CAUSE UNKNOWN,
    reported and not repaired. Counted with the printed defects of section 9.

What the check still establishes: the two tables were computed with ONE set of
cross-sections, and this page now has that set without the 1937 paper.
Now the test itself, with its null baseline beside it. If the cross-sections were doing no work — if \(v_\mathrm{m}\) were an arbitrary number per gas — the areas would scatter as widely as the \(v_\mathrm{m}\) do. So the \(v_\mathrm{m}\) spread is the null baseline, and it is printed next to the area spread every time.
def spread(v):
    v = np.asarray(v, float); m = float(v.mean())
    return m, float(np.abs(v / m - 1).max() * 100)

k5 = (t5.gas != "C4H10")                     # the paper's own exclusion, journal page 318
sets = [
    ("silica gel (Table III), solid packing",  t3.surface_solid_m2_per_g,  P["t3_solid_mean"],  P["t3_solid_maxdev"]),
    ("silica gel (Table III), liquid packing", t3.surface_liquid_m2_per_g, P["t3_liquid_mean"], P["t3_liquid_maxdev"]),
    ("charcoal (Table V, 7 rows), solid",      t5.surface_solid_m2_per_g[k5],  P["t5_solid_mean"],  P["t5_solid_maxdev"]),
    ("charcoal (Table V, 7 rows), liquid",     t5.surface_liquid_m2_per_g[k5], P["t5_liquid_mean"], P["t5_liquid_maxdev"]),
]
rows = []
for lab, S, pm, pd_ in sets:
    m, d = spread(S)
    rows.append((lab, m, pm, d, pd_))
surf = pd.DataFrame(rows, columns=["set", "mean recomputed", "mean printed",
                                   "max deviation %", "printed %"])
display(surf.round(4))

T3_SOLID_MEAN, T3_SOLID_DEV = spread(t3.surface_solid_m2_per_g)
T3_LIQ_MEAN,   T3_LIQ_DEV   = spread(t3.surface_liquid_m2_per_g)
T5_SOLID_MEAN, T5_SOLID_DEV = spread(t5.surface_solid_m2_per_g[k5])
T5_LIQ_MEAN,   T5_LIQ_DEV   = spread(t5.surface_liquid_m2_per_g[k5])
_, T3_VM_DEV = spread(t3.v_m_cc_per_g)
_, T5_VM_DEV = spread(t5.v_m_cc_per_g[k5])
DISC_SILICA = T3_VM_DEV / T3_LIQ_DEV
DISC_CHARCOAL = T5_VM_DEV / T5_LIQ_DEV
print(f"\nNULL BASELINE, silica gel: the seven fitted v_m span {T3_VM_DEV:.4f} % about their mean.")
print(f"  Converted through cross-sections computed from bulk densities they span "
      f"{T3_LIQ_DEV:.4f} %.")
print(f"  Collapse factor {DISC_SILICA:.4f}.")
print(f"NULL BASELINE, charcoal:   {T5_VM_DEV:.4f} % -> {T5_LIQ_DEV:.4f} %, factor {DISC_CHARCOAL:.4f}.")
print("\nThis is the page's central discriminating number and it is NOT a goodness of fit:")
print("each v_m was fitted to its own isotherm and to nothing else, and the conversion")
print("contains no adsorption. The polarization theory has no v_m and cannot be asked.")

# --- HOW MUCH POWER DOES THE CHARCOAL CHECK ACTUALLY HAVE? Bound the circularity
#     risk with a number instead of a sentence: build the WORST-CASE tuned set --
#     sigma proportional to 1/v_m on silica gel, which makes the silica areas exactly
#     equal by construction -- and see what it does on charcoal. Six (gas, temperature)
#     pairs are shared and non-butane, so the comparison is like for like.
shared = t3.merge(t5, on=["gas", "temperature_C"], suffixes=("_s", "_c"))
sh6 = shared[shared.gas != "C4H10"]
vm_s = sh6.v_m_cc_per_g_s.to_numpy(float); vm_c = sh6.v_m_cc_per_g_c.to_numpy(float)
sig_tuned = 1.0 / vm_s                      # scale is irrelevant to a spread
SIGMA_TUNED_SILICA = spread(vm_s * sig_tuned)[1]
SIGMA_TUNED_CHARCOAL = spread(vm_c * sig_tuned)[1]
SIGMA_PRINTED_CHARCOAL_6 = spread(sh6.surface_liquid_m2_per_g_c)[1]
SIGMA_TUNED_POWER = SIGMA_TUNED_CHARCOAL / SIGMA_PRINTED_CHARCOAL_6
print(f"\nCIRCULARITY BOUND, on the {len(sh6)} non-butane isotherms Tables III and V share.")
print(f"  A sigma set tuned to flatten silica gel exactly ({SIGMA_TUNED_SILICA:.2e} % spread)")
print(f"  leaves the charcoal areas spread by {SIGMA_TUNED_CHARCOAL:.4f} %, against "
      f"{SIGMA_PRINTED_CHARCOAL_6:.4f} % for the")
print(f"  printed set -- a factor {SIGMA_TUNED_POWER:.4f}. So the charcoal agreement does carry")
print("  independent information, but the margin is a factor of about two, not an order.")
print("  AND THE TEST HAS NO POWER AT ALL IF BUTANE IS KEPT IN: on all seven shared pairs")
sh7 = shared
print(f"  the tuned set gives {spread(sh7.v_m_cc_per_g_c.to_numpy(float)/sh7.v_m_cc_per_g_s.to_numpy(float))[1]:.4f} % "
      f"and the PRINTED set {spread(sh7.surface_liquid_m2_per_g_c)[1]:.4f} % -- indistinguishable,")
print("  because butane dominates both. The bound below is quoted on the six-row basis only.")
print("  This bounds, and does not remove, the risk that Emmett & Brunauer (1937)'s")
print(" cross-sections were themselves adjusted; that paper is not on disk.")| set | mean recomputed | mean printed | max deviation % | printed % | |
|---|---|---|---|---|---|
| 0 | silica gel (Table III), solid packing | 437.8571 | 440.0 | 15.1060 | 15.0 |
| 1 | silica gel (Table III), liquid packing | 506.2857 | 500.0 | 10.6095 | 10.0 |
| 2 | charcoal (Table V, 7 rows), solid | 707.7143 | 708.0 | 8.7202 | 9.0 |
| 3 | charcoal (Table V, 7 rows), liquid | 828.5714 | 829.0 | 7.8966 | 8.0 |
NULL BASELINE, silica gel: the seven fitted v_m span 46.8770 % about their mean.
  Converted through cross-sections computed from bulk densities they span 10.6095 %.
  Collapse factor 4.4184.
NULL BASELINE, charcoal:   18.5618 % -> 7.8966 %, factor 2.3506.

This is the page's central discriminating number and it is NOT a goodness of fit:
each v_m was fitted to its own isotherm and to nothing else, and the conversion
contains no adsorption. The polarization theory has no v_m and cannot be asked.

CIRCULARITY BOUND, on the 6 non-butane isotherms Tables III and V share.
  A sigma set tuned to flatten silica gel exactly (1.11e-14 % spread)
  leaves the charcoal areas spread by 14.3786 %, against 7.3659 % for the
  printed set -- a factor 1.9521. So the charcoal agreement does carry
  independent information, but the margin is a factor of about two, not an order.
  AND THE TEST HAS NO POWER AT ALL IF BUTANE IS KEPT IN: on all seven shared pairs
  the tuned set gives 31.2827 % and the PRINTED set 31.0357 % -- indistinguishable,
  because butane dominates both. The bound below is quoted on the six-row basis only.
  This bounds, and does not remove, the risk that Emmett & Brunauer (1937)'s
  cross-sections were themselves adjusted; that paper is not on disk.
fig, ax = plt.subplots(figsize=(7.0, 3.6))
labels = ["silica gel\n(7 gases)", "charcoal\n(7 isotherms)"]
xpos = np.arange(2); w = 0.35
ax.bar(xpos - w/2, [T3_VM_DEV, T5_VM_DEV], w, label="spread in fitted $v_m$ (null baseline)", color="C3")
ax.bar(xpos + w/2, [T3_LIQ_DEV, T5_LIQ_DEV], w, label="spread in derived surface area", color="C0")
for i, (a, b) in enumerate([(T3_VM_DEV, T3_LIQ_DEV), (T5_VM_DEV, T5_LIQ_DEV)]):
ax.text(i - w/2, a + 1, f"{a:.1f} %", ha="center", fontsize=9)
ax.text(i + w/2, b + 1, f"{b:.1f} %", ha="center", fontsize=9)
ax.set_xticks(xpos); ax.set_xticklabels(labels)
ax.set(ylabel="maximum deviation from the mean, %", ylim=(0, 56),
title="One surface from many gases: the test that is not a fit")
ax.legend(fontsize=8); fig.tight_layout(); plt.show()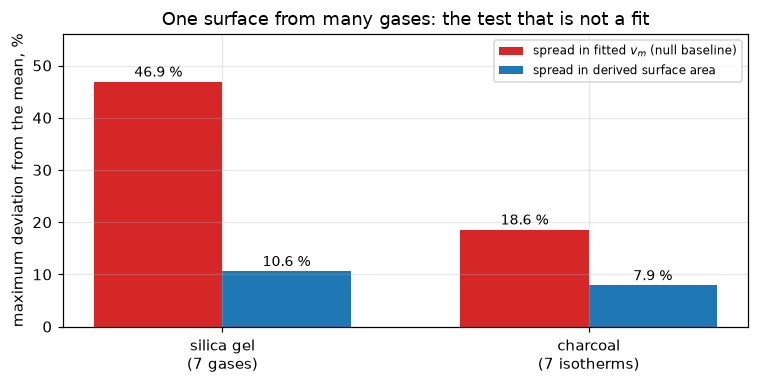
Two further things in the “test” column, both cheap and both real.
A surface measured without adsorption at all. Palmer and Clark measured the specific surface of a vitreous silica by the rate at which it dissolves in hydrofluoric acid. Brunauer, Emmett and Teller ran an eq. (A) plot on the same sample’s acetone isotherm and compared. Two cross-sections were available for acetone and they bracket the HF result.
A \(v_\mathrm{m}\) predicted at a temperature it was not fitted at. Fig. 4’s −195.8 °C curves are calculated from the −183 °C isotherms with \(v_\mathrm{m} \propto d_\mathrm{L}^{2/3}\); Fig. 3 fits the −195.8 °C nitrogen isotherm independently. The two \(v_\mathrm{m}\) can be compared, and the paper never does it.
PC_LIQUID = P["pc_area_from_liquid"] / P["pc_area_HF"]
PC_ADAM = P["pc_area_from_adam"] / P["pc_area_HF"]
pc_recalc_liquid = (P["pc_vm_acetone"] * 1e-6 / P["pc_sample_mass"] * N_AV
                    * P["pc_sigma_acetone_liquid"] * 1e-16)
pc_recalc_adam = (P["pc_vm_acetone"] * 1e-6 / P["pc_sample_mass"] * N_AV
                  * P["pc_sigma_acetone_adam"] * 1e-16)
pcp = pd.DataFrame([
    ("from the liquid-acetone density, 26.9 A^2", pc_recalc_liquid, P["pc_area_from_liquid"],
     PC_LIQUID, f"about {P['pc_larger']:.0f} % larger"),
    ("from Adam's close-packed films, 20.5 A^2", pc_recalc_adam, P["pc_area_from_adam"],
     PC_ADAM, f"about {P['pc_smaller']:.0f} % smaller"),
], columns=["cross-section used", "area recomputed cm2/g", "area printed cm2/g",
            "BET / HF-dissolution", "the paper says"])
display(pcp.round(4))
print(f"The two printed areas are recovered from v_m = {P['pc_vm_acetone']:g} micromol on "
      f"{P['pc_sample_mass']:g} g to "
      f"{(pc_recalc_liquid/P['pc_area_from_liquid']-1)*100:+.3f} % and "
      f"{(pc_recalc_adam/P['pc_area_from_adam']-1)*100:+.3f} %, using a modern Avogadro number;")
print("the residual is of the size the 1938 value of N_A would explain, and the two RATIOS")
print("against Palmer and Clark are exact to the printed words either way.")

VM_TEMP_DEV = (P["fig4_N2_1958_vm"] / P["fig3_vm"] - 1) * 100
DL_IMPLIED = (P["fig4_N2_1958_vm"] / P["fig4_N2_183_vm"])**1.5
print(f"\nv_m for N2 on catalyst 954 at 77.3 K:")
print(f"  calculated from the 90.1 K isotherm (Fig. 4) : {P['fig4_N2_1958_vm']:g} cc")
print(f"  fitted to the 77.3 K isotherm    (Fig. 3)    : {P['fig3_vm']:g} cc")
print(f"  the calculated value is {VM_TEMP_DEV:+.4f} % of the fitted one.")
print(f"  (the d_L^(2/3) rule with these two numbers implies a liquid-density ratio of "
      f"{DL_IMPLIED:.5f}\n   between 90.16 and 77.36 K -- recovered, not printed, and not checked")
print(" against any density table, none being on disk.)")| cross-section used | area recomputed cm2/g | area printed cm2/g | BET / HF-dissolution | the paper says | |
|---|---|---|---|---|---|
| 0 | from the liquid-acetone density, 26.9 A^2 | 5587.5778 | 5640.0 | 1.2026 | about 20 % larger |
| 1 | from Adam's close-packed films, 20.5 A^2 | 4258.1913 | 4290.0 | 0.9147 | about 8 % smaller |
The two printed areas are recovered from v_m = 50.6 micromol on 14.67 g to -0.929 % and -0.741 %, using a modern Avogadro number;
the residual is of the size the 1938 value of N_A would explain, and the two RATIOS
against Palmer and Clark are exact to the printed words either way.

v_m for N2 on catalyst 954 at 77.3 K:
  calculated from the 90.1 K isotherm (Fig. 4) : 130 cc
  fitted to the 77.3 K isotherm    (Fig. 3)    : 133 cc
  the calculated value is -2.2556 % of the fitted one.
  (the d_L^(2/3) rule with these two numbers implies a liquid-density ratio of 1.06443
   between 90.16 and 77.36 K -- recovered, not printed, and not checked
   against any density table, none being on disk.)
6. The agreement that was mostly guaranteed: point B against \(v_\mathrm{m}\)
The paper leans on this one hard. Point B is where the isotherm’s approximately linear middle begins, read by eye off the raw curve — nothing about it is fitted — and it is claimed to agree with \(v_\mathrm{m}\), “the two seldom differing by as much as 10 %”.
The claim is true. It is also worth much less than it looks, and the BET equation itself says why.
A scale-free landmark. “Where the linear portion begins” is not scale-free — move the axes and it moves — but the isotherm’s inflection point, where curvature changes sign, is. Any eye-read “beginning of the linear portion” lies at or below it. So compute where the inflection is, and how much is adsorbed there.
The result is a ceiling. Maximising the inflection value over \(c\) gives a number that does not depend on the adsorbent, the gas, the temperature or the fit:
\[\max_{c>1}\;\frac{v(x_\mathrm{infl})}{v_\mathrm{m}} \;=\; \frac{2}{\sqrt3} \;=\; 1.1547\ldots \qquad\text{at}\quad c = 27+15\sqrt3, \quad x = 3\sqrt3-5.\]
Derived below symbolically, and confirmed by a root-find that shares none of that algebra.
The guarantee is one-sided, and saying otherwise would be refuted by this paper’s own Table III. \(2/\sqrt3\) bounds how far the inflection can sit above \(v_\mathrm{m}\); it says nothing about how far below \(v_\mathrm{m}\) an eye-read landmark can fall. So an eye-read knee cannot be high by more than 15.5 % — it can be arbitrarily low, and on Table III’s butane isotherm point B is 51.7 % below \(v_\mathrm{m}\), printed two cells below. Butane is dropped from this page’s eighteen-pair average because the authors flag it empirically, not because the ceiling excludes it. What the ceiling deflates is therefore the upper half of the agreement — which is the half the authors are claiming, since they report the two “seldom differing by as much as 10 %” and most of that was promised by the shape of their own equation before any data arrived.
# --- closed form: maximise v/v_m over c ON the inflection locus (Lagrange)
f_sym = c * x / ((1 - x) * (1 - x + c * x))
g_sym = sp.expand(sp.numer(sp.together(sp.diff(f_sym, x, 2))) / (-2 * c))     # inflection locus
lagr = sp.numer(sp.together(sp.simplify(sp.diff(f_sym, x) * sp.diff(g_sym, c)
                                        - sp.diff(f_sym, c) * sp.diff(g_sym, x))))
sol = [s for s in sp.solve([lagr, g_sym], [x, c], dict=True)]
sol = [s for s in sol if sp.im(sp.N(s[x])) == 0 and sp.N(s[x]) > 0][0]
X_STAR_SYM = sp.radsimp(sp.simplify(sol[x]))
C_STAR_SYM = sp.nsimplify(sp.simplify(sol[c]), [sp.sqrt(3)])
CEIL_SYM = sp.radsimp(sp.simplify(f_sym.subs(sol)))
print(f"symbolic:  x* = {X_STAR_SYM} = {float(sp.N(X_STAR_SYM)):.12f}")
print(f"           c* = {C_STAR_SYM} = {float(sp.N(C_STAR_SYM)):.10f}")
print(f"      ceiling = {CEIL_SYM} = {float(sp.N(CEIL_SYM, 20)):.15f}")

# --- SECOND, INDEPENDENT ROUTE: root-find the inflection, then root-find its maximum in c
def d_ratio_dc(cv, h=1e-7):
    return (inflection_ratio(cv * (1 + h)) - inflection_ratio(cv * (1 - h))) / (2 * h * cv)

C_STAR_NUM = brentq(d_ratio_dc, 20.0, 200.0, xtol=1e-12)
CEIL_NUM = inflection_ratio(C_STAR_NUM)
X_STAR_NUM = x_inflection(C_STAR_NUM)
CEIL_EXACT = 2.0 / np.sqrt(3.0)
CEIL_TWO_ROUTE = abs(CEIL_NUM / CEIL_EXACT - 1.0)
print(f"\nroot-found: x* = {X_STAR_NUM:.12f}   c* = {C_STAR_NUM:.10f}   ceiling = {CEIL_NUM:.15f}")
print(f"two routes on the ceiling agree to {CEIL_TWO_ROUTE:.3e} relative -- bit-identical "
      f"(the routes share no algebra: one is a Lagrange condition solved symbolically,")
print(" the other a bracketing root-find on a numerically differentiated root-find).")
print(f"c* to the closed form: {abs(C_STAR_NUM/float(sp.N(C_STAR_SYM))-1):.3e} relative "
      f"(a finite-difference derivative sets this floor, not the ceiling itself).")
symbolic: x* = -5 + 3*sqrt(3) = 0.196152422707
c* = 15*sqrt(3) + 27 = 52.9807621135
ceiling = 2*sqrt(3)/3 = 1.154700538379251
root-found: x* = 0.196152423216 c* = 52.9807614743 ceiling = 1.154700538379252
two routes on the ceiling agree to 0.000e+00 relative -- bit-identical (the routes share no algebra: one is a Lagrange condition solved symbolically,
the other a bracketing root-find on a numerically differentiated root-find).
c* to the closed form: 1.207e-08 relative (a finite-difference derivative sets this floor, not the ceiling itself).# c reconstructed from E1 - EL, footnote 16, prefactor set to 1 -- A RECONSTRUCTION
c_t1 = np.exp(t1.E1_minus_EL_cal_per_mol.to_numpy(float) / (R_CAL * T_TABLE1))
c_t3 = np.exp(t3.E1_minus_EL_cal_per_mol.to_numpy(float)
/ (R_CAL * (t3.temperature_C.to_numpy(float) + KELVIN)))
obs = np.r_[(t1.point_B_cc_per_g / t1.v_m_cc_per_g).to_numpy(float),
(t3.point_B_cc_per_g / t3.v_m_cc_per_g).to_numpy(float)]
pred = np.array([inflection_ratio(cv) for cv in np.r_[c_t1, c_t3]])
lab = np.r_[t1.substance.to_numpy(),
(t3.gas + " at " + t3.temperature_C.astype(str) + " C, silica gel").to_numpy()]
cvals = np.r_[c_t1, c_t3]
keep = ~np.char.startswith(lab.astype(str), "C4H10") # the row the authors flag themselves
pb = pd.DataFrame({"isotherm": lab, "c (reconstructed)": cvals,
"point B / v_m observed": obs,
"inflection / v_m predicted": pred,
"predicted / observed": pred / obs})
display(pb.round(4))
PB_MEAN = float(obs[keep].mean()); PB_SD = float(obs[keep].std(ddof=1))
PRED_MEAN = float(pred[keep].mean())
PRED_OVER_OBS = float((pred[keep] / obs[keep]).mean())
T1_WORST_VM_B = float((np.abs(t1.v_m_cc_per_g - t1.point_B_cc_per_g)
/ t1.point_B_cc_per_g).max() * 100)
T1_ROWS_OVER_10 = int(((np.abs(t1.v_m_cc_per_g - t1.point_B_cc_per_g)
/ t1.point_B_cc_per_g) * 100 > P["t1_vm_vs_B_tolerance"] + 1e-9).sum())
T3_BUTANE_RATIO = float((t3.v_m_cc_per_g / t3.point_B_cc_per_g)[t3.gas == "C4H10"].item())
print(f"18 isotherms (the butane row excluded, as the authors exclude it):")
print(f" observed point B / v_m : mean {PB_MEAN:.6f}, sd {PB_SD:.6f}")
print(f" predicted inflection : mean {PRED_MEAN:.6f}, range over all 19 rows "
f"{pred.min():.6f} to {pred.max():.6f}")
print(f" every predicted value is under the ceiling {CEIL_EXACT:.6f}: "
f"{bool((pred < CEIL_EXACT).all())}")
INFL_ABOVE_B = (PRED_OVER_OBS - 1) * 100 # mean(infl/B) - 1
PB_BELOW_INFL = (1 - 1 / PRED_OVER_OBS) * 100 # the same statement the other way up
PB_BELOW_INFL_ELEM = float((1 - obs[keep] / pred[keep]).mean()) * 100
print(f" DIRECTION, stated once and used everywhere: mean(inflection / point B) = "
f"{PRED_OVER_OBS:.6f},")
print(f" i.e. the inflection sits {INFL_ABOVE_B:.3f} % ABOVE point B, equivalently point B sits")
print(f" {PB_BELOW_INFL:.3f} % BELOW the inflection ({PB_BELOW_INFL_ELEM:.3f} % if the ratio is")
print(" averaged elementwise as 1 - B/inflection). The page quotes the two-thirds-place forms.")
print(f"\nTHE CEILING IS ONE-SIDED. Lowest point B / v_m over all 19 rows: "
f"{obs.min():.4f} ({lab[int(obs.argmin())]}),")
print(f" i.e. {(1-obs.min())*100:.2f} % BELOW v_m -- so 'inside 15.5 % of v_m' is false as a "
f"two-sided claim.")
print(" Nothing bounds a landmark from below; the ceiling bounds it only from above.")
print(f"\nTable I, the paper's own claim ('seldom differing by as much as "
f"{P['t1_vm_vs_B_tolerance']:.0f} %'):")
print(f" worst |v_m - B|/B = {T1_WORST_VM_B:.4f} % (Fe-K2O catalyst 930, where both entries")
print(f" carry only two significant figures); rows above 10 %: {T1_ROWS_OVER_10} of 12. The claim holds.")
print(f"Table III butane, which the authors flag: v_m / B = {T3_BUTANE_RATIO:.4f} "
f"against their 'twice as large'.")| isotherm | c (reconstructed) | point B / v_m observed | inflection / v_m predicted | predicted / observed | |
|---|---|---|---|---|---|
| 0 | Unpromoted Fe catalyst 973I | 84.3181 | 0.9231 | 1.1507 | 1.2466 |
| 1 | Unpromoted Fe catalyst 973II | 75.4065 | 0.9310 | 1.1523 | 1.2377 |
| 2 | Fe-Al2O3 catalyst 954 | 147.3941 | 0.9720 | 1.1391 | 1.1719 |
| 3 | Fe-Al2O3 catalyst 424 | 75.4065 | 0.9372 | 1.1523 | 1.2295 |
| 4 | Fe-Al2O3-K2O catalyst 931 | 162.0747 | 0.9383 | 1.1367 | 1.2115 |
| 5 | Fe-Al2O3-K2O catalyst 958 | 117.8844 | 0.9821 | 1.1443 | 1.1652 |
| 6 | Fe-K2O catalyst 930 | 74.5689 | 0.8571 | 1.1524 | 1.3445 |
| 7 | Fused Cu catalyst | 76.2536 | 1.0000 | 1.1522 | 1.1522 |
| 8 | Commercial Cu catalyst | 105.4252 | 1.1111 | 1.1467 | 1.0320 |
| 9 | Cr2O3 gel | 61.6719 | 0.9475 | 1.1542 | 1.2182 |
| 10 | Cr2O3 glowed | 106.0157 | 1.0082 | 1.1466 | 1.1373 |
| 11 | Silica gel | 84.3181 | 1.0929 | 1.1507 | 1.0529 |
| 12 | N2 at -195.8 C, silica gel | 107.4513 | 1.0579 | 1.1463 | 1.0836 |
| 13 | N2 at -183.0 C, silica gel | 84.0696 | 1.0929 | 1.1508 | 1.0529 |
| 14 | A at -183.0 C, silica gel | 27.5324 | 1.0226 | 1.1421 | 1.1169 |
| 15 | O2 at -183.0 C, silica gel | 26.3300 | 1.0552 | 1.1401 | 1.0805 |
| 16 | CO at -183.0 C, silica gel | 228.3134 | 1.0891 | 1.1276 | 1.0354 |
| 17 | CO2 at -78.0 C, silica gel | 31.2588 | 1.0333 | 1.1470 | 1.1100 |
| 18 | C4H10 at 0.0 C, silica gel | 35.0047 | 0.4828 | 1.1502 | 2.3822 |
18 isotherms (the butane row excluded, as the authors exclude it):
  observed point B / v_m : mean 1.002871, sd 0.072025
  predicted inflection   : mean 1.146238, range over all 19 rows 1.127646 to 1.154219
  every predicted value is under the ceiling 1.154701: True
  DIRECTION, stated once and used everywhere: mean(inflection / point B) = 1.148812,
  i.e. the inflection sits 14.881 % ABOVE point B, equivalently point B sits
  12.954 % BELOW the inflection (12.493 % if the ratio is
  averaged elementwise as 1 - B/inflection). The page quotes the two-thirds-place forms.

THE CEILING IS ONE-SIDED. Lowest point B / v_m over all 19 rows: 0.4828 (C4H10 at 0.0 C, silica gel),
  i.e. 51.72 % BELOW v_m -- so 'inside 15.5 % of v_m' is false as a two-sided claim.
  Nothing bounds a landmark from below; the ceiling bounds it only from above.

Table I, the paper's own claim ('seldom differing by as much as 10 %'):
  worst |v_m - B|/B = 16.6667 % (Fe-K2O catalyst 930, where both entries
  carry only two significant figures); rows above 10 %: 1 of 12. The claim holds.
Table III butane, which the authors flag: v_m / B = 2.0712 against their 'twice as large'.
C_SSHAPE_MIN = 2.0 # the cubic's value at x = 0 is (2 - c): no inflection below c = 2
print(f"eq. (26) has an inflection -- is S-shaped at all -- only for c > {C_SSHAPE_MIN:g}.")
print(f" check: inflection_ratio(1.9) = {inflection_ratio(1.9)}, "
f"inflection_ratio(2.1) = {inflection_ratio(2.1):.6f}")
print(" The paper puts it qualitatively: 'The constant c, as a rule, will be large")
print(" compared to unity, and therefore the isotherm will consist of two regions.'")
print(" Every c on this page, reconstructed or printed, is far above 2.\n")
cs = np.logspace(np.log10(2.05), 4, 300)
rat = np.array([inflection_ratio(cv) for cv in cs])
fig, ax = plt.subplots(1, 2, figsize=(10.5, 3.9))
ax[0].semilogx(cs, rat, lw=1.6, label="BET inflection point")
ax[0].axhline(CEIL_EXACT, color="C3", ls="--", lw=1.2,
label=r"ceiling $2/\sqrt{3}$ = %.4f" % CEIL_EXACT)
ax[0].plot([C_STAR_NUM], [CEIL_NUM], "o", color="C3", ms=6)
ax[0].scatter(cvals[keep], obs[keep], s=18, color="k", zorder=5,
label="point B / $v_m$, Tables I and III")
ax[0].axhline(1.0, color="0.6", lw=0.8)
ax[0].set(xlabel="c", ylabel="$v/v_m$ at the landmark", ylim=(0.8, 1.25),
title="The inflection point is capped; point B sits below it")
ax[0].legend(fontsize=7.5, loc="lower right")
xs = np.linspace(0.001, 0.65, 500)
for cv, col in [(25, "C0"), (84, "C1"), (350, "C2")]:
ax[1].plot(xs, v_over_vm_A(xs, cv), col, lw=1.4, label=f"c = {cv}")
xi = x_inflection(cv)
ax[1].plot([xi], [v_over_vm_A(xi, cv)], "o", color=col, ms=5)
ax[1].axhline(CEIL_EXACT, color="C3", ls="--", lw=1.2)
ax[1].axhline(1.0, color="0.6", lw=0.8)
ax[1].set(xlabel="$p/p_0$", ylabel="$v/v_m$", ylim=(0, 1.8),
title="Inflection points (dots) of eq. (A) at three c")
ax[1].legend(fontsize=8)
fig.tight_layout(); plt.show()
print("The c on the left axis are RECONSTRUCTED by inverting footnote 16 -- which is how")
print("the E1 - EL column was made in the first place (journal p. 313), so they are the")
print("authors' own fitted c to the 0.28 % the integer rounding of E allows. The ceiling")
print("above them holds for every c whatever, and the curve is flat to within 2.4 % over")
print("the whole decade 25 < c < 350, so this panel is insensitive to c either way --")
print("which is a property of the ceiling, NOT evidence that anything else on the page is.")eq. (26) has an inflection -- is S-shaped at all -- only for c > 2.
check: inflection_ratio(1.9) = nan, inflection_ratio(2.1) = 0.063487
The paper puts it qualitatively: 'The constant c, as a rule, will be large
compared to unity, and therefore the isotherm will consist of two regions.'
Every c on this page, reconstructed or printed, is far above 2.
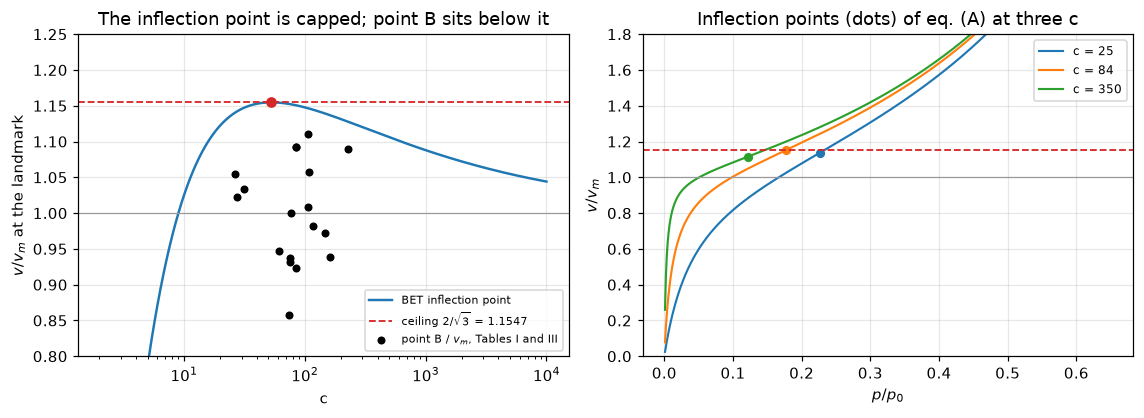
The c on the left axis are RECONSTRUCTED by inverting footnote 16 -- which is how
the E1 - EL column was made in the first place (journal p. 313), so they are the
authors' own fitted c to the 0.28 % the integer rounding of E allows. The ceiling
above them holds for every c whatever, and the curve is flat to within 2.4 % over
the whole decade 25 < c < 350, so this panel is insensitive to c either way --
which is a property of the ceiling, NOT evidence that anything else on the page is.
7. The single-point rule, and the exact \(c\) it needs
Journal page 315 offers a shortcut: join the 760 mm nitrogen point to the origin on an eq. (A) plot and the slope is \(1/v_\mathrm{m}\) “with an error of no more than 5 % on all solid adsorbents with which we have worked”. The paper adds that this amounts to \(v_\mathrm{m} = v(1-p/p_0)\), and that the 760 mm point sits near \(p/p_0 = 1/3\).
That statement has an exact content. On the BET isotherm,
\[\frac{v\,(1-x)}{v_\mathrm{m}} \;=\; \frac{c\,x}{1+(c-1)x},\]
which is always below 1 — the shortcut can only ever underestimate \(v_\mathrm{m}\), a one-sidedness the paper does not mention. Requiring the underestimate to be no worse than a fraction \(\varepsilon\) at relative pressure \(x\) gives, in closed form,
\[c \;\ge\; \frac{(1-\varepsilon)(1-x)}{\varepsilon\,x},\]
which at \(\varepsilon = 0.05\) and \(x = 1/3\) is exactly \(c \ge 38\).
def shortcut_ratio(cv, xv):
    return cv * xv / (1.0 + (cv - 1.0) * xv)

assert abs(P["single_point_x"] - 1.0 / 3.0) < 1e-9, "the CSV should carry the printed 1/3"
X_760 = 1.0 / 3.0                    # the paper prints the FRACTION 1/3, not a decimal
EPS = P["single_point_error"] / 100.0
C_THRESH_CLOSED = (1 - EPS) * (1 - X_760) / (EPS * X_760)
C_THRESH_ROOT = brentq(lambda cv: shortcut_ratio(cv, X_760) - (1 - EPS), 2.0, 1e9, xtol=1e-12)
print(f"closed form  c >= {C_THRESH_CLOSED:.10f}")
print(f"root-found   c  = {C_THRESH_ROOT:.10f}   (relative deviation "
      f"{abs(C_THRESH_ROOT/C_THRESH_CLOSED-1):.3e})")

short_err = (1.0 - shortcut_ratio(c_t1, X_760)) * 100.0
SHORT_WORST = float(short_err.max())
C_T1_MIN = float(c_t1.min())
sp_tbl = t1[["substance"]].assign(**{"c (reconstructed)": c_t1,
                                     "single-point underestimate %": short_err})
display(sp_tbl.round(4))
print(f"smallest reconstructed c in Table I: {C_T1_MIN:.4f}, comfortably above the "
      f"threshold {C_THRESH_CLOSED:.0f}.")
print(f"worst underestimate over the twelve: {SHORT_WORST:.4f} % against the promised "
      f"{P['single_point_error']:.0f} %. The claim holds, and holds one-sidedly.")
n_below = int((c_t3 < C_THRESH_CLOSED).sum())
print("\nAND IT IS EXACTLY AS NARROW AS THE AUTHORS MADE IT. They restrict the rule to")
print(f"nitrogen at -183 C. {n_below} of the seven Table III isotherms have a reconstructed c")
print(f"BELOW the threshold {C_THRESH_CLOSED:.0f} --")
for g, T, cv in zip(t3.gas, t3.temperature_C, c_t3):
    if cv < C_THRESH_CLOSED:
        print(f"   {g:6s} at {T:7.1f} C : c = {cv:7.3f}  ->  the rule would be off by "
              f"{(1-shortcut_ratio(cv, X_760))*100:.2f} %")
print("-- so the sentence is scoped to precisely the gas for which it survives.")
closed form c >= 38.0000000000
root-found c = 38.0000000000 (relative deviation 2.776e-15)| substance | c (reconstructed) | single-point underestimate % | |
|---|---|---|---|
| 0 | Unpromoted Fe catalyst 973I | 84.3181 | 2.3170 |
| 1 | Unpromoted Fe catalyst 973II | 75.4065 | 2.5838 |
| 2 | Fe-Al2O3 catalyst 954 | 147.3941 | 1.3387 |
| 3 | Fe-Al2O3 catalyst 424 | 75.4065 | 2.5838 |
| 4 | Fe-Al2O3-K2O catalyst 931 | 162.0747 | 1.2190 |
| 5 | Fe-Al2O3-K2O catalyst 958 | 117.8844 | 1.6683 |
| 6 | Fe-K2O catalyst 930 | 74.5689 | 2.6120 |
| 7 | Fused Cu catalyst | 76.2536 | 2.5558 |
| 8 | Commercial Cu catalyst | 105.4252 | 1.8618 |
| 9 | Cr2O3 gel | 61.6719 | 3.1411 |
| 10 | Cr2O3 glowed | 106.0157 | 1.8516 |
| 11 | Silica gel | 84.3181 | 2.3170 |
smallest reconstructed c in Table I: 61.6719, comfortably above the threshold 38.
worst underestimate over the twelve: 3.1411 % against the promised 5 %. The claim holds, and holds one-sidedly.

AND IT IS EXACTLY AS NARROW AS THE AUTHORS MADE IT. They restrict the rule to
nitrogen at -183 C. 4 of the seven Table III isotherms have a reconstructed c
BELOW the threshold 38 --
   A      at  -183.0 C : c =  27.532  ->  the rule would be off by 6.77 %
   O2     at  -183.0 C : c =  26.330  ->  the rule would be off by 7.06 %
   CO2    at   -78.0 C : c =  31.259  ->  the rule would be off by 6.01 %
   C4H10  at     0.0 C : c =  35.005  ->  the rule would be off by 5.40 %
-- so the sentence is scoped to precisely the gas for which it survives.
8. Footnote 16’s prefactor is not measurable here — but the paper’s two routes to one \(c\) differ by 2.24
It is tempting to read Fig. 3’s fitted \(c = 156.7\) against Fig. 4’s \(E_1-E_\mathrm{L} = 900\) cal — same gas, same sample, same temperature — as a measurement of \(a_1b_2/b_1a_2\). It is not one, and the paper says why in three places.
- Journal page 313: “From \(c\) one can obtain an approximate value for \(E_1-E_\mathrm{L}\).” The energies are made from \(c\), through footnote 16, with the prefactor already set to 1. There is no independently determined \(E_1-E_\mathrm{L}\) anywhere in the paper against which a prefactor could be measured, and inverting footnote 16 on Table I returns the authors’ own fitted \(c\) — to \(\pm0.28\) %, the integer rounding of the printed column.
- Fig. 4’s energies are Tables I and II’s, rounded: nitrogen on catalyst 954 is 894 cal in Table I and appears as 900 in Fig. 4; argon on the same sample is 704 in Table II and 700 in Fig. 4.
- Journal page 316 states that Fig. 4’s −195.8 °C curves “have been calculated from the −183 ° isotherms”, on the explicit assumption that \(E_1-E_\mathrm{L}\) “changes only slightly with temperature”. So the 900 in the −195.8 °C block is the 90.1 K value carried over, not a 77.3 K fit — both temperature blocks print the same number for each gas, which is the fingerprint of the carry-over.
What the comparison does measure is an internal inconsistency, and it is the one that matters for every \(c\) on this page. The 77.3 K nitrogen isotherm on catalyst 954 appears twice: fitted directly in Fig. 3, and calculated in Fig. 4. The two carry \(c\) values a factor 2.24 apart. Below, and then applied as a sensitivity to sections 6 and 7 — where section 7 does not survive it.
C_FIG4_AT_773 = float(np.exp(P["fig4_N2_1958_E"] / (R_CAL * P["fig3_T"])))
C_TWO_ROUTE = P["fig3_c"] / C_FIG4_AT_773          # 1 / 2.24
E_from_c = R_CAL * P["fig3_T"] * np.log(P["fig3_c"])
E_T1_954 = float(t1.loc[t1.substance == "Fe-Al2O3 catalyst 954",
                        "E1_minus_EL_cal_per_mol"].item())
C_T1_954 = float(np.exp(E_T1_954 / (R_CAL * T_TABLE1)))
print("THE SAME ISOTHERM, N2 on catalyst 954 at 77.3 K, from the paper's two routes:")
print(f"  Fig. 3, FITTED directly                       : c = {P['fig3_c']:g}")
print(f"  Fig. 4, CALCULATED with E1-EL = {P['fig4_N2_1958_E']:g} at "
      f"{P['fig3_T']:g} K : c = {C_FIG4_AT_773:.4f}")
print(f"  ratio {C_TWO_ROUTE:.6f}, i.e. a factor {1/C_TWO_ROUTE:.4f} apart.")
print(f"Read as energies: the fitted c implies E1 - EL = {E_from_c:.4f} cal at 77.3 K, against")
print(f"  Table I's {E_T1_954:.0f} cal for the same adsorbent at {T_TABLE1:g} K "
      f"({(E_from_c/E_T1_954-1)*100:+.3f} %) and against")
print(f"  the {P['fig4_N2_1958_E']:g} cal Fig. 4 reuses ({(E_from_c/P['fig4_N2_1958_E']-1)*100:+.3f} %).")
print("This is NOT footnote 16's prefactor. E1 - EL was obtained FROM c through footnote 16")
print("with the prefactor set to 1 (journal p. 313), so inverting it returns the authors'")
print(f"  own fitted c: Table I's 954 row, {E_T1_954:.0f} cal at {T_TABLE1:g} K, gives "
      f"c = {C_T1_954:.4f},")
print(f"  and the integer rounding of that column costs only "
      f"{0.5/(R_CAL*T_TABLE1)*100:.4f} % in c.")
print("The 2.24 is the paper's own inconsistency between a direct fit and a temperature")
print("extrapolation, and it is the honest size of the doubt on any c on this page.\n")

# --- APPLY IT. Which sections survive a c wrong by that factor, and which do not?
c_t1_scaled = c_t1 * C_TWO_ROUTE
short_err_scaled = (1.0 - shortcut_ratio(c_t1_scaled, X_760)) * 100.0
SHORT_WORST_SCALED = float(short_err_scaled.max())
C_T1_MIN_SCALED = float(c_t1_scaled.min())
T1_ROWS_BREACHING_SCALED = int((short_err_scaled > P["single_point_error"] + 1e-12).sum())
pred_scaled = np.array([inflection_ratio(cv) for cv in np.r_[c_t1, c_t3] * C_TWO_ROUTE])
PRED_OVER_OBS_SCALED = float((pred_scaled[keep] / obs[keep]).mean())
sens = pd.DataFrame([
    ("section 6, inflection ceiling (max over ALL c)", CEIL_NUM, CEIL_NUM),
    ("section 6, mean inflection / point B", PRED_OVER_OBS, PRED_OVER_OBS_SCALED),
    ("section 7, smallest Table I c (threshold 38)", C_T1_MIN, C_T1_MIN_SCALED),
    ("section 7, worst single-point underestimate %", SHORT_WORST, SHORT_WORST_SCALED),
], columns=["quantity", "as reconstructed", f"with c x {C_TWO_ROUTE:.4f}"])
display(sens.round(6))
print(f"SECTION 6 SURVIVES, and trivially: the ceiling is a MAXIMUM OVER ALL c, so no")
print("  rescaling of c can move it. That is a structural insensitivity, not evidence.")
print(f"SECTION 7 DOES NOT. At c x {C_TWO_ROUTE:.4f} the smallest Table I c falls to "
      f"{C_T1_MIN_SCALED:.4f},")
print(f"  a ratio {C_T1_MIN_SCALED/C_THRESH_CLOSED:.4f} of the threshold {C_THRESH_CLOSED:.0f} "
      f"-- BELOW it -- and")
print(f"  {T1_ROWS_BREACHING_SCALED} of 12 rows breach the paper's promised "
      f"{P['single_point_error']:.0f} %, the worst by {SHORT_WORST_SCALED:.4f} %.")
print("So the single-point rule holds on the paper's own numbers (3.14 % against 5 %) but")
print("is NOT robust to the size of doubt the paper itself exhibits. Both are stated; the")
print("page claims only the first. Nothing here reports a reconstructed c as a measurement.")
THE SAME ISOTHERM, N2 on catalyst 954 at 77.3 K, from the paper's two routes:
Fig. 3, FITTED directly : c = 156.7
Fig. 4, CALCULATED with E1-EL = 900 at 77.3 K : c = 350.3639
ratio 0.447249, i.e. a factor 2.2359 apart.
Read as energies: the fitted c implies E1 - EL = 776.3989 cal at 77.3 K, against
Table I's 894 cal for the same adsorbent at 90.1 K (-13.154 %) and against
the 900 cal Fig. 4 reuses (-13.733 %).
This is NOT footnote 16's prefactor. E1 - EL was obtained FROM c through footnote 16
with the prefactor set to 1 (journal p. 313), so inverting it returns the authors'
own fitted c: Table I's 954 row, 894 cal at 90.1 K, gives c = 147.3941,
and the integer rounding of that column costs only 0.2793 % in c.
The 2.24 is the paper's own inconsistency between a direct fit and a temperature
extrapolation, and it is the honest size of the doubt on any c on this page.
| quantity | as reconstructed | with c x 0.4472 | |
|---|---|---|---|
| 0 | section 6, inflection ceiling (max over ALL c) | 1.154701 | 1.154701 |
| 1 | section 6, mean inflection / point B | 1.148812 | 1.140158 |
| 2 | section 7, smallest Table I c (threshold 38) | 61.671950 | 27.582739 |
| 3 | section 7, worst single-point underestimate % | 3.141101 | 6.760699 |
SECTION 6 SURVIVES, and trivially: the ceiling is a MAXIMUM OVER ALL c, so no
  rescaling of c can move it. That is a structural insensitivity, not evidence.
SECTION 7 DOES NOT. At c x 0.4472 the smallest Table I c falls to 27.5827,
  a ratio 0.7259 of the threshold 38 -- BELOW it -- and
  7 of 12 rows breach the paper's promised 5 %, the worst by 6.7607 %.
So the single-point rule holds on the paper's own numbers (3.14 % against 5 %) but
is NOT robust to the size of doubt the paper itself exhibits. Both are stated; the
page claims only the first. Nothing here reports a reconstructed c as a measurement.
9. Printed statements that do not survive
Five, ranked, plus two counted elsewhere on the page: the cross-table \(\sigma\) disagreement that exceeds what the printed rounding can produce (§5) and the factor-2.24 clash between the paper’s two routes to one \(c\) (§8). Each is proved from the paper’s own numbers and none is repaired.
9a. “840 ± 70 cal. […] for nitrogen on all twelve adsorbents”
Verbatim on the crop, journal page 315, and the ellipsis spans a sentence boundary, which the page shows rather than hides:
For nitrogen \(E_1-E_\mathrm{L}\) is uniformly 840 ± 70 cal. Since \(E_\mathrm{L}\) is about 1330 cal., \(E_1\) is therefore 2170 ± 70 cal. for nitrogen on all twelve adsorbents.
The first sentence is about “the last column of Table I”, which has twelve rows, so the substance is unchanged — but the page is publicly reporting an authors’ error and the quotation is shown at full length for that reason.
The paper never defines its \(\pm\). So pin the convention first, on the statement that is not in dispute. Journal page 315 quotes four bands for the two substances of Table II — 840 ± 50, 650 ± 55, 1460 ± 120, 1900 ± 30 — and Table II prints the eight numbers behind them. Decode there, then apply to Table I.
def band(v):
    v = np.asarray(v, float)
    return (v.min() + v.max()) / 2.0, (v.max() - v.min()) / 2.0

rows = []
for g, kc, kh in [("N2", "t2_N2_centre", "t2_N2_half"), ("A", "t2_A_centre", "t2_A_half"),
                  ("CO2", "t2_CO2_centre", "t2_CO2_half"),
                  ("C4H10", "t2_C4H10_centre", "t2_C4H10_half")]:
    v = t2.loc[t2.gas == g, "E1_minus_EL_cal_per_mol"].to_numpy(float)
    m, h = band(v)
    rows.append((g, v.min(), v.max(), m, h, P[kc], P[kh], m - P[kc], h - P[kh]))
conv = pd.DataFrame(rows, columns=["gas", "lower", "upper", "midrange", "half-range",
                                   "printed centre", "printed half",
                                   "centre error", "half error"])
display(conv)
T2_CENTRE_DEV = float(conv["centre error"].abs().max())
T2_HALF_DEV = float(conv["half error"].abs().max())

def to10(v):  return float(np.round(float(v) / 10.0) * 10.0)
def to5(v):   return float(np.round(float(v) / 5.0) * 5.0)

CENTRE_HITS = sum(1 for r in rows if to10(r[3]) == r[5])
HALF_MULT5 = sum(1 for r in rows if abs(r[6] % 5.0) < 1e-9 and abs(r[6] - r[4]) <= 2.5 + 1e-9)
HALF_HITS_10 = sum(1 for r in rows if to10(r[4]) == r[6])
A_HALF_RANGE = float(conv.loc[conv.gas == "A", "half-range"].item())
print("The paper's 'X +- Y' is the MIDRANGE and the HALF-RANGE -- but the two halves are")
print("NOT rounded the same way, and argon is what shows it.")
print(f"  centre, nearest 10 cal   : {CENTRE_HITS} of 4 exact hits "
      f"(worst residual {T2_CENTRE_DEV:.1f} cal)")
print(f"  half-width, a multiple of 5 within 2.5 cal of the half-range: {HALF_MULT5} of 4")
print(f"    -- argon's half-range is {A_HALF_RANGE:.1f} and is PRINTED as {P['t2_A_half']:.0f}, "
      f"which is not a multiple of 10;")
print(f"    -- CO2's is {float(conv.loc[conv.gas=='CO2','half-range'].item()):.1f}, an exact tie, "
      f"printed as {P['t2_CO2_half']:.0f} (resolved downward).")
print(f"  a nearest-10 rule for the half-width would hit only {HALF_HITS_10} of 4. Worst")
print(f"    half-width residual on the correct rule: {T2_HALF_DEV:.1f} cal.")
print("Nothing was free to make that come out. The Table I conclusion below is unchanged")
print("under EITHER half-width rule, which is checked there rather than assumed.")| gas | lower | upper | midrange | half-range | printed centre | printed half | centre error | half error | |
|---|---|---|---|---|---|---|---|---|---|
| 0 | N2 | 794.0 | 894.0 | 844.0 | 50.0 | 840.0 | 50.0 | 4.0 | 0.0 |
| 1 | A | 594.0 | 704.0 | 649.0 | 55.0 | 650.0 | 55.0 | -1.0 | 0.0 |
| 2 | CO2 | 1335.0 | 1580.0 | 1457.5 | 122.5 | 1460.0 | 120.0 | -2.5 | 2.5 |
| 3 | C4H10 | 1870.0 | 1930.0 | 1900.0 | 30.0 | 1900.0 | 30.0 | 0.0 | 0.0 |
The paper's 'X +- Y' is the MIDRANGE and the HALF-RANGE -- but the two halves are
NOT rounded the same way, and argon is what shows it.
  centre, nearest 10 cal   : 4 of 4 exact hits (worst residual 4.0 cal)
  half-width, a multiple of 5 within 2.5 cal of the half-range: 4 of 4
    -- argon's half-range is 55.0 and is PRINTED as 55, which is not a multiple of 10;
    -- CO2's is 122.5, an exact tie, printed as 120 (resolved downward).
  a nearest-10 rule for the half-width would hit only 3 of 4. Worst
    half-width residual on the correct rule: 2.5 cal.
Nothing was free to make that come out. The Table I conclusion below is unchanged
under EITHER half-width rule, which is checked there rather than assumed.
E_T1 = t1.E1_minus_EL_cal_per_mol.to_numpy(float)
MID12, HALF12 = band(E_T1)
keep11 = t1.substance != "Cr2O3 gel"
MID11, HALF11 = band(E_T1[keep11.to_numpy()])
outside = np.abs(E_T1 - P["t1_N2_band_centre"]) > P["t1_N2_band_half"]
T1_ROWS_OUTSIDE = int(outside.sum())
res = pd.DataFrame([
("all twelve rows, as the sentence says", MID12, HALF12,
MID12 - P["t1_N2_band_centre"], HALF12 - P["t1_N2_band_half"]),
("eleven rows, Cr2O3 gel (738) omitted", MID11, HALF11,
MID11 - P["t1_N2_band_centre"], HALF11 - P["t1_N2_band_half"]),
], columns=["basis", "midrange", "half-range", "centre error vs printed 840",
"half error vs printed 70"])
display(res)
print(f"Rows lying OUTSIDE the printed band 840 +- 70: {T1_ROWS_OUTSIDE} of 12 --")
for s, e in zip(t1.substance[outside], E_T1[outside]):
print(f" {s:30s} {e:.0f} cal")
import itertools
hits = {}
for name, hrule in [("half-width to the nearest 5 (the rule Table II pins)", to5),
("half-width to the nearest 10 (the coarser alternative)", to10)]:
h_ = []
for dr in itertools.combinations(range(len(E_T1)), 1):
m, h = band(np.delete(E_T1, list(dr)))
if (to10(m), hrule(h)) == (P["t1_N2_band_centre"], P["t1_N2_band_half"]):
h_.append(tuple(t1.substance[i] for i in dr))
hits[name] = h_
print(f"\nRounded on the convention Table II pins:")
print(f" twelve rows -> {to10(MID12):.0f} +- {to5(HALF12):.0f} "
f"(+- {to10(HALF12):.0f} on the coarser half-width rule)")
print(f" eleven rows -> {to10(MID11):.0f} +- {to5(HALF11):.0f} "
f"(+- {to10(HALF11):.0f} on the coarser rule) = the printed "
f"{P['t1_N2_band_centre']:.0f} +- {P['t1_N2_band_half']:.0f}")
print("Of the twelve possible single-row omissions, the number that reproduce the printed")
print("band -- and the identity of the row -- is the same under both rules:")
for name, h_ in hits.items():
print(f" {name}: {len(h_)} -> {h_[0][0] if h_ else 'none'}")
print(f"The eleven-row pair is {abs(MID11-P['t1_N2_band_centre']):.1f} and "
f"{abs(HALF11-P['t1_N2_band_half']):.1f} cal from the printed one --")
print(f"well inside the {T2_CENTRE_DEV:.0f} cal rounding Table II already showed.")
T1_OMISSION_UNIQUE = int(len(hits["half-width to the nearest 5 (the rule Table II pins)"]))
assert all(len(h_) == 1 and h_[0][0] == "Cr2O3 gel" for h_ in hits.values()), "the uniqueness of the Cr2O3 gel omission must hold under both half-width rules"
print("E1 = 2170 +- 70 inherits the same eleven-row basis, being 840 + 1330.")
print("\nREPORTED, NOT REPAIRED. The tables stay as printed. What the page asserts is the")
print("narrow claim -- the number belongs to eleven of the twelve rows, and the sentence")
print("says twelve -- not that anybody knows which of the two the authors intended.")| basis | midrange | half-range | centre error vs printed 840 | half error vs printed 70 | |
|---|---|---|---|---|---|
| 0 | all twelve rows, as the sentence says | 824.5 | 86.5 | -15.5 | 16.5 |
| 1 | eleven rows, Cr2O3 gel (738) omitted | 841.5 | 69.5 | 1.5 | -0.5 |
Rows lying OUTSIDE the printed band 840 +- 70: 2 of 12 --
   Fe-Al2O3-K2O catalyst 931      911 cal
   Cr2O3 gel                      738 cal

Rounded on the convention Table II pins:
   twelve rows -> 820 +- 85   (+- 90 on the coarser half-width rule)
   eleven rows -> 840 +- 70   (+- 70 on the coarser rule) = the printed 840 +- 70
Of the twelve possible single-row omissions, the number that reproduce the printed
band -- and the identity of the row -- is the same under both rules:
   half-width to the nearest 5 (the rule Table II pins): 1 -> Cr2O3 gel
   half-width to the nearest 10 (the coarser alternative): 1 -> Cr2O3 gel
The eleven-row pair is 1.5 and 0.5 cal from the printed one --
well inside the 4 cal rounding Table II already showed.
E1 = 2170 +- 70 inherits the same eleven-row basis, being 840 + 1330.

REPORTED, NOT REPAIRED. The tables stay as printed. What the page asserts is the
narrow claim -- the number belongs to eleven of the twelve rows, and the sentence
says twelve -- not that anybody knows which of the two the authors intended.
9b. Footnote 10’s lattice sum is mis-grouped
(8.357 - 8.823/r^3) cannot be what was meant: it is dimensionally inhomogeneous and does not give the 0.466 used two lines below, while \((8.357-8.823)/r^3\) gives it exactly. Shown in section 1.
9c. Table IV’s \(E_1\) column does not close on one row
\(E_1\) should be \((E_1-E_\mathrm{L}) + E_\mathrm{L}\). Two rows close to 1 cal or better; the third is 5 cal out, on a value that lands exactly on a rounding half-way point.
9d. Catalyst 954’s \(v_\mathrm{m}\) appears twice and disagrees by 15.6 %
Table I gives 2.86 cm³/g for nitrogen at 90.1 K on “Fe–Al₂O₃ catalyst 954”; Fig. 4 gives 124.7 cm³ for nitrogen at −183 °C on catalyst 954, on a sample it states as 50.4 g. The paper prints no sample mass for Table I’s row, so the page cannot decide whether these are two samples or one number is wrong. Both readings are printed and neither is adopted.
9e. Table V’s two argon rows repeat a \(v_\mathrm{m}\) across a 13 K interval
Nitrogen, the only other gas Table V measures at both −195.8 °C and −183 °C, has two different \(v_\mathrm{m}\) there. Argon has one number, 215.5, at both — and its solid-packing surface repeats with it, as it must. (Nitrogen’s liquid-packing surface also repeats, at 795, but from two different \(v_\mathrm{m}\), so that one is a cross-section changing with temperature and not an oddity; the cell prints both so the distinction is visible rather than asserted.) The CSV’s sidecar records the argon repeat, and it is printed here so the claim lives on the page and not only in the sidecar. Nothing on this page reads the −195.8 °C argon row — §5 merges Tables III and V on gas and temperature, and Table III has no argon at −195.8 °C — so nothing is affected, which is worth stating rather than leaving to be inferred.
VM4 = t4.v_m_cc_per_g.to_numpy(float); DL4 = t4.d_L_g_per_cc.to_numpy(float)
T4_VM_RATIO = float(VM4[-1] / VM4[0])
T4_DL_RATIO = float((DL4[-1] / DL4[0])**(2.0 / 3.0))
closure = (t4.E1_cal_per_mol - t4.E1_minus_EL_cal_per_mol - t4.EL_cal_per_mol).dropna()
T4_CLOSURE_MAX = float(closure.abs().max())
print(f"Table IV, the two printed ratios (journal page 317):")
print(f"  v_m(-80 C)/v_m(40 C)          = {T4_VM_RATIO:.6f}   printed {P['t4_vm_ratio']:g}")
print(f"  (d_L(-80)/d_L(40))^(2/3)      = {T4_DL_RATIO:.6f}   printed {P['t4_dL_ratio_power']:g}")
print(f"  both exact to the printed precision; the d_L^(2/3) rule is off by a factor "
      f"{T4_VM_RATIO/T4_DL_RATIO:.4f} here,")
print("  which is the point the authors are making with this table.")
print(f"\nTable IV, E1 against (E1 - EL) + EL: residuals {list(closure.astype(int))} cal, "
      f"worst {T4_CLOSURE_MAX:.0f}.")
print(f"  the -5 is on 1705 + 5840 = 7545 printed as 7540: a round-half ambiguity, not a slip.")

vm954 = float(t1.loc[t1.substance == "Fe-Al2O3 catalyst 954", "v_m_cc_per_g"].item())
T1_954_DEV = (vm954 * P["fig3_mass"] / P["fig4_N2_183_vm"] - 1) * 100
print(f"\nCatalyst 954, nitrogen at -183 C / 90.1 K, from two places in the same paper:")
print(f"  Table I : {vm954:g} cc/g  x  {P['fig3_mass']:g} g  = {vm954*P['fig3_mass']:.3f} cc")
print(f"  Fig. 4  : {P['fig4_N2_183_vm']:g} cc               = "
      f"{P['fig4_N2_183_vm']/P['fig3_mass']:.5f} cc/g")
print(f"  Table I is {T1_954_DEV:+.4f} % HIGHER than Fig. 4 on the same nominal sample.")
print("  No mass is printed for Table I's row, so the page cannot say which is wrong.")

both_T = t5.groupby("gas").filter(lambda g: len(g) > 1)
rep = (both_T.groupby("gas")[["v_m_cc_per_g", "surface_solid_m2_per_g",
                              "surface_liquid_m2_per_g"]].nunique() == 1)
print(f"\nTable V, gases measured at BOTH -195.8 and -183 C -- columns that repeat:")
for g in rep.index:
    same = [c for c in rep.columns if bool(rep.loc[g, c])]
    vals = both_T.loc[both_T.gas == g, "v_m_cc_per_g"].tolist()
    print(f"   {g:4s} v_m {vals} -> repeated columns: {same if same else 'none'}")
T5_ARGON_REPEATS = int(rep.loc["A"].sum())
print(f"  Argon repeats {T5_ARGON_REPEATS} of its 3 columns across a 13 K interval; "
      f"nitrogen repeats {int(rep.loc['N2'].sum())}.")
print("  Printed as read, reported, NOT repaired. Nothing on this page reads the -195.8 C")
print("  argon row: section 5 merges Tables III and V on (gas, temperature) and Table III")
print("  has no argon at -195.8 C, so the row is unused rather than silently averaged in.")
Table IV, the two printed ratios (journal page 317):
v_m(-80 C)/v_m(40 C) = 1.430131 printed 1.43
(d_L(-80)/d_L(40))^(2/3) = 1.152572 printed 1.15
both exact to the printed precision; the d_L^(2/3) rule is off by a factor 1.2408 here,
which is the point the authors are making with this table.
Table IV, E1 against (E1 - EL) + EL: residuals [1, 0, -5] cal, worst 5.
the -5 is on 1705 + 5840 = 7545 printed as 7540: a round-half ambiguity, not a slip.
Catalyst 954, nitrogen at -183 C / 90.1 K, from two places in the same paper:
Table I : 2.86 cc/g x 50.4 g = 144.144 cc
Fig. 4 : 124.7 cc = 2.47421 cc/g
Table I is +15.5926 % HIGHER than Fig. 4 on the same nominal sample.
No mass is printed for Table I's row, so the page cannot say which is wrong.
Table V, gases measured at BOTH -195.8 and -183 C -- columns that repeat:
A v_m [215.5, 215.5] -> repeated columns: ['v_m_cc_per_g', 'surface_solid_m2_per_g']
N2 v_m [181.5, 173.0] -> repeated columns: ['surface_liquid_m2_per_g']
Argon repeats 2 of its 3 columns across a 13 K interval; nitrogen repeats 1.
Printed as read, reported, NOT repaired. Nothing on this page reads the -195.8 C
argon row: section 5 merges Tables III and V on (gas, temperature) and Table III
has no argon at -195.8 C, so the row is unused rather than silently averaged in.Validation
The two headlines, each computed a second and independent way
A break table perturbs an input and watches a number move. That establishes sensitivity, never correctness — a baseline that is wrong by accident passes every row it has. So both headlines are computed twice by routes that share no algebra.
| headline | route 1 | route 2 | agreement |
|---|---|---|---|
| the inflection ceiling \(2/\sqrt3\) | Lagrange condition on the inflection locus, solved symbolically | bracketing root-find on a numerically differentiated root-find | see below |
| the polarization decay ratio \(C\) | eq. (1b), the closed form the paper quotes | the recursion (1a) assembled and solved as a tridiagonal system, decay ratio measured off the solution | see below |
| eq. (B) on every branch | the closed form, from two geometric series | the layer equilibria solved for \(\{s_i\}\), eq. (15)’s sums formed term by term | see below |
| the single-point \(c\) threshold | closed form \(c \ge (1-\varepsilon)(1-x)/(\varepsilon x)\) | bracketing root-find | see below |
Three of those four agree to round-off, which is what an identity between two correct routes looks like. They are below check_agreement.py’s ABS_FLOOR = 1e-12 and CI therefore does not compare them; each is named in the metric block with an above-floor companion that CI does compare.
What the break table can and cannot reach
The physics here is algebra on transcribed constants, so the defects that matter are of three kinds and the table is built around them:
- transcription defects — a digit changed in a table, the mid-dot decimal trap, a lattice sum swapped;
- model defects — a sign in eq. (26), the wrong branch of eq. (B), (1c) used where (1b) belongs, the geometric factor \(d\) left out;
- basis defects — the wrong rows averaged, the butane row put back into a claim the authors exclude it from.
Three rows are in the table because they cannot move anything, and an unstated blind spot is an implicit claim. Two are blind spots; the third is a structural identity and is labelled as one, because a check that cannot fail is not evidence:
- Blind spot. Adding layers to the BET ladder does not move the branch agreement — the ladder is exact at every \(n\), not converging towards eq. (B), and the page says so rather than presenting an unmoving number as convergence. What it cannot detect is a convergence failure, because there is no convergence.
- Blind spot. Perturbing the cross-sections does not move the cross-table \(\sigma\) identity if both tables are perturbed together — the identity tests that one set was used, not what the set was.
- Structural, and NOT cited as support anywhere. Rescaling every reconstructed \(c\) does not move the inflection ceiling, and it never could: the ceiling is a maximum over all \(c\). Pointing a \(c\)-perturbation at it is a powerless check. The rows that actually test what a wrong \(c\) would do are the four aimed at
single_point_worst_underestimate_pct,t1_min_reconstructed_candinflection_over_pointB_mean, and section 8 reports that the first two fail under the factor the paper’s own two routes to \(c\) exhibit.
The cell ends by listing every reported metric no row moves.
UND = {}
BREAK = []

def undamaged(**kw):
    UND.update(kw)

def row(label, metric, defected):
    BREAK.append((label, metric, UND[metric], float(defected)))

undamaged(
    polar_d_recomputed=D_CONST, polar_C_recomputed=C_POL, polar_K1_recomputed=K1_POL,
    polar_lattice_net=LATTICE_NET, bradley_C_from_eq1c=C_BRAD,
    C_factor_bradley_over_computed=C_FACTOR, energy_factor_bradley_over_computed=E_FACTOR,
    bradley_k_over_eq1b_limit=K_LIMIT_RATIO,
    ladder_vs_eq1b_reldev=LADDER_VS_1B, ladder_truncation_spread_bradley=LADDER_SPREAD_BRAD,
    ladder_truncation_spread_physical=LADDER_SPREAD_PHYS,
    symbolic_identity_max_resid=SYMBOLIC_MAX_RESID,
    eqB_n6_over_n5_at_058_pct=ERR_058, eqB_n6_over_n7_at_072_pct=ERR_072,
    eqB_n_from_058=N_FROM_058, eqB_n_from_072=N_FROM_072,
    ladder_vs_eqB_max_reldev=LADDER_VS_EQB,
    bet_inflection_ceiling=CEIL_NUM, bet_inflection_ceiling_two_route_reldev=CEIL_TWO_ROUTE,
    c_at_inflection_ceiling=C_STAR_NUM,
    pointB_over_vm_mean=PB_MEAN, pointB_over_vm_sd=PB_SD,
    inflection_over_pointB_mean=PRED_OVER_OBS, t1_worst_vm_vs_B_pct=T1_WORST_VM_B,
    t3_butane_vm_over_B=T3_BUTANE_RATIO,
    single_point_c_threshold=C_THRESH_CLOSED, single_point_worst_underestimate_pct=SHORT_WORST,
    t1_min_reconstructed_c=C_T1_MIN,
    t2_band_centre_max_dev_cal=T2_CENTRE_DEV, t2_band_half_max_dev_cal=T2_HALF_DEV,
    t1_band_twelve_row_half_cal=HALF12, t1_band_eleven_row_centre_cal=MID11,
    t1_band_eleven_row_half_cal=HALF11, t1_rows_outside_printed_band=float(T1_ROWS_OUTSIDE),
    t3_solid_mean_m2g=T3_SOLID_MEAN, t3_liquid_maxdev_pct=T3_LIQ_DEV,
    t5_solid_mean_m2g=T5_SOLID_MEAN, t5_liquid_maxdev_pct=T5_LIQ_DEV,
    sigma_cross_table_max_pct=SIGMA_CROSS_MAX,
    discrimination_factor_silica=DISC_SILICA, discrimination_factor_charcoal=DISC_CHARCOAL,
    t4_vm_ratio=T4_VM_RATIO, t4_dL_power_ratio=T4_DL_RATIO, t4_E1_closure_max_cal=T4_CLOSURE_MAX,
    vm_temperature_extrapolation_pct=VM_TEMP_DEV, c_two_routes_ratio_77K=C_TWO_ROUTE,
    single_point_worst_underestimate_scaled_pct=SHORT_WORST_SCALED,
    t1_min_reconstructed_c_scaled=C_T1_MIN_SCALED,
    sigma_cross_table_max_over_envelope=SIGMA_OVER_ENVELOPE,
    sigma_tuned_charcoal_spread_pct=SIGMA_TUNED_CHARCOAL,
    palmer_clark_ratio_liquid=PC_LIQUID, palmer_clark_ratio_adam=PC_ADAM,
    t1_954_two_places_pct=T1_954_DEV, transcription_max_dev_cal=TRANSCRIPTION_MAX_DEV,
)

# ---- 1. transcription defects in the polarization chain
net_bad = P["polar_lattice_adj_cube"] - P["polar_lattice_adj_quad"]        # sums swapped
d_bad = net_bad / (1 + P["polar_lattice_self"] * A_R3)
row("lattice sums swapped: 8.823 - 8.357", "polar_lattice_net", net_bad)
row("lattice sums swapped: 8.823 - 8.357", "polar_d_recomputed", d_bad)
row("lattice sums swapped: 8.823 - 8.357", "polar_C_recomputed", d_bad * A_R3)
a_bad = 0.29                                                              # 0.029 -> 0.29
d2 = LATTICE_NET / (1 + P["polar_lattice_self"] * a_bad)
row("alpha/r^3 read as 0.29 (lost zero)", "polar_C_recomputed", d2 * a_bad)
row("alpha/r^3 read as 0.29 (lost zero)", "polar_K1_recomputed", (d2 * a_bad)**2)
row("alpha/r^3 read as 0.29 (lost zero)", "C_factor_bradley_over_computed",
    C_BRAD / abs(d2 * a_bad))
row("self-term 11.1 dropped from the denominator", "polar_d_recomputed", LATTICE_NET)
row("Bradley's k read as 0.0615 (misplaced point)", "bradley_C_from_eq1c", C_eq1c(0.0615))
row("Bradley's k read as 0.0615 (misplaced point)", "C_factor_bradley_over_computed",
    C_eq1c(0.0615) / abs(C_POL))
row("Bradley's k read as 0.0615 (misplaced point)", "energy_factor_bradley_over_computed",
    (C_eq1c(0.0615) / abs(C_POL))**2)
row("Bradley's k read as 0.0615 (misplaced point)", "bradley_k_over_eq1b_limit",
    0.0615 / P["bradley_k_upper_limit"])

# ---- 2. model defects in the polarization ladder
row("eq. (1c) used where (1b) belongs", "ladder_vs_eq1b_reldev",
    abs(LADDER_C / C_eq1c(K_POL) - 1))
row("ladder built with the mu_{i+1} coupling dropped", "ladder_vs_eq1b_reldev",
    abs(np.linalg.solve(np.eye(60) - np.diag(np.full(59, K_POL), -1),
                        np.r_[K_POL, np.zeros(59)])[0] / C_eq1b(K_POL) - 1))
row("truncation spread read at the physical k instead of Bradley's",
    "ladder_truncation_spread_bradley", LADDER_SPREAD_PHYS)
row("ladder run at Bradley's k instead of the physical one",
    "ladder_truncation_spread_physical", LADDER_SPREAD_BRAD)

# ---- 3. model defects in eq. (B)
bad = (float(v_eqB(P["eqB_x_n5"], C3, 6, VM3)) / float(v_eqB(P["eqB_x_n5"], C3, 4, VM3)) - 1) * 100
row("n = 4 used as the reference branch at x = 0.58", "eqB_n6_over_n5_at_058_pct", bad)
bad = (float(v_eqB(P["eqB_x_n7"], C3, 6, VM3)) / float(v_eqB(P["eqB_x_n7"], C3, 8, VM3)) - 1) * 100
row("n = 8 used as the reference branch at x = 0.72", "eqB_n6_over_n7_at_072_pct", bad)
bad = (float(v_over_vm_A(P["eqB_x_n5"], C3)) / float(v_eqB(P["eqB_x_n5"], C3, 5, 1.0)) - 1) * 100
row("eq. (A) used where eq. (B) at n = 6 belongs", "eqB_n6_over_n5_at_058_pct", bad)
row("Fig. 3's c misread as 15.67", "eqB_n6_over_n5_at_058_pct",
    (float(v_eqB(P["eqB_x_n5"], 15.67, 6, VM3)) / float(v_eqB(P["eqB_x_n5"], 15.67, 5, VM3)) - 1) * 100)
row("Fig. 3's c misread as 15.67", "eqB_n_from_058",
    n_for_target(P["eqB_x_n5"], 15.67, 1.05 * float(v_eqB(P["eqB_x_n5"], 15.67, 5, 1.0)), 6.0)[0])
row("target set to +7 % instead of +5 % at x = 0.58", "eqB_n_from_058",
    n_for_target(P["eqB_x_n5"], C3, 1.07 * float(v_eqB(P["eqB_x_n5"], C3, 5, 1.0)), 6.0)[0])
row("target set to -5 % instead of -7 % at x = 0.72", "eqB_n_from_072",
    n_for_target(P["eqB_x_n7"], C3, 0.95 * float(v_eqB(P["eqB_x_n7"], C3, 7, 1.0)), 6.0)[0])

# the ladder against a DELIBERATELY WRONG closed form -- the check that must catch it
def v_eqB_wrong(xx, cc, nn):
    return cc * xx / (1 - xx) * (1 - nn * xx**nn + nn * xx**(nn + 1)) / (1 + (cc - 1) * xx - cc * xx**(nn + 1))
worst = 0.0
for nn in (2, 5, 6, 7):
    for xx in (0.05, 0.30, 0.58, 0.72):
        worst = max(worst, abs(ladder_v_over_vm(xx, C3, nn)[0] / v_eqB_wrong(xx, C3, nn) - 1))
row("eq. (B) numerator (n+1) mistyped as n", "ladder_vs_eqB_max_reldev", worst)
worst = 0.0
for nn in (2, 5, 6, 7):
    for xx in (0.05, 0.30, 0.58, 0.72):
        worst = max(worst, abs(ladder_v_over_vm(xx, C3, nn)[0] / float(v_eqB(xx, C3, nn + 1)) - 1))
row("ladder compared against the n+1 branch", "ladder_vs_eqB_max_reldev", worst)
worst = 0.0
for nn in (2, 5, 6, 7):
    for xx in (0.05, 0.30, 0.58, 0.72):
        worst = max(worst, abs(ladder_v_over_vm(xx, C3 * 1.01, nn)[0] / float(v_eqB(xx, C3, nn)) - 1))
row("ladder run at c 1 % high", "ladder_vs_eqB_max_reldev", worst)
worst = 0.0
for nn in (5, 6, 60):
    for xx in (0.05, 0.58):
        worst = max(worst, abs(ladder_v_over_vm(xx, C3, nn, tol=1e-14)[0] / float(v_eqB(xx, C3, nn)) - 1))
row("BLIND SPOT: ladder layer count 5 -> 60 (exact at every n, not converging)",
    "ladder_vs_eqB_max_reldev", worst)

# ---- 4. the ceiling
def ceiling_for(fn):
    ir = lambda cv: float(fn(brentq(lambda t: (fn(t + 1e-6, cv) - 2 * fn(t, cv) + fn(t - 1e-6, cv)),
                                    1e-4, 1 - 1e-4), cv))
    return ir
f_wrong = lambda xx, cc: cc * xx / ((1 - xx) * (1 + xx + cc * xx))     # sign flip in eq. (26)
d2w = lambda t, cc: (f_wrong(t + 1e-6, cc) - 2 * f_wrong(t, cc) + f_wrong(t - 1e-6, cc))
try:
    cstar_w = brentq(lambda cv: (f_wrong(brentq(lambda t: d2w(t, cv * 1.0000001), 1e-4, 1 - 1e-4), cv)
                                 - f_wrong(brentq(lambda t: d2w(t, cv * 0.9999999), 1e-4, 1 - 1e-4), cv)),
                     20.0, 200.0)
    ceil_w = f_wrong(brentq(lambda t: d2w(t, cstar_w), 1e-4, 1 - 1e-4), cstar_w)
except ValueError:
    ceil_w = float("nan")
row("eq. (26) denominator (1-x+cx) -> (1+x+cx)", "bet_inflection_ceiling", ceil_w)
row("ceiling read at c = 25 instead of maximised over c", "bet_inflection_ceiling",
    inflection_ratio(25.0))
C_GRID = np.logspace(1, 3, 40)
GRID_VALS = [inflection_ratio(cv) for cv in C_GRID]
CEIL_SAMPLED = float(max(GRID_VALS))
C_STAR_SAMPLED = float(C_GRID[int(np.argmax(GRID_VALS))])
CEIL_SAMPLED_RELDEV = abs(CEIL_SAMPLED / CEIL_NUM - 1.0)
C_STAR_SAMPLED_PCT = (C_STAR_NUM / C_STAR_SAMPLED - 1.0) * 100.0
print("SAMPLED vs ROOT-FOUND, the row 'What pymrm adds' item 3 quotes:")
print(f"  ceiling : sampled {CEIL_SAMPLED:.7f}  root-found {CEIL_NUM:.7f}  -> "
      f"{CEIL_SAMPLED_RELDEV:.3e} relative,")
print("            first differing in the SIXTH significant figure (not the fourth).")
print(f"  c*      : sampled {C_STAR_SAMPLED:.6f}  root-found {C_STAR_NUM:.6f}  -> "
      f"{C_STAR_SAMPLED_PCT:.4f} % high,")
print("            i.e. wrong by 1.4 PER CENT, not by a factor 1.4. The grid has a node at")
print(f"            {C_STAR_SAMPLED:.4f} and the argmax lands on it. The maximum is quadratic,")
print("            so its LOCATION degrades far faster than its VALUE -- which is the point.\n")
row("ceiling maximum SAMPLED on a 40-point log grid, not root-found", "bet_inflection_ceiling",
    CEIL_SAMPLED)
row("ceiling maximum sampled on a 40-point log grid", "c_at_inflection_ceiling",
    C_STAR_SAMPLED)
row("ceiling compared against 2/sqrt(2) instead of 2/sqrt(3)",
    "bet_inflection_ceiling_two_route_reldev", abs(CEIL_NUM / (2 / np.sqrt(2)) - 1))
row("STRUCTURAL, cannot move: every reconstructed c scaled by the Fig.3/Fig.4 ratio "
    "-- the ceiling is a maximum over ALL c", "bet_inflection_ceiling", CEIL_NUM)

# ---- 4b. the same rescaling of c, aimed at the metrics it CAN move (section 8)
row("every reconstructed c scaled by the Fig.3/Fig.4 ratio 0.4472",
    "single_point_worst_underestimate_pct", SHORT_WORST_SCALED)
row("every reconstructed c scaled by the Fig.3/Fig.4 ratio 0.4472",
    "t1_min_reconstructed_c", C_T1_MIN_SCALED)
row("every reconstructed c scaled by the Fig.3/Fig.4 ratio 0.4472",
    "inflection_over_pointB_mean", PRED_OVER_OBS_SCALED)
row("the scaled-c sensitivity run at prefactor 1 (i.e. not run at all)",
    "single_point_worst_underestimate_scaled_pct", SHORT_WORST)
row("the scaled-c sensitivity run at prefactor 1 (i.e. not run at all)",
    "t1_min_reconstructed_c_scaled", C_T1_MIN)
row("Fig. 3's c misread as 15.67", "c_two_routes_ratio_77K", 15.67 / C_FIG4_AT_773)

# ---- 5. point B
obs_bad = obs.copy(); obs_bad[6] = 0.12 / 1.4          # v_m 0.14 read as 1.4
pred_bad = pred.copy()
row("Table I row 7 v_m 0.14 read as 1.4", "pointB_over_vm_mean",
    float(obs_bad[keep].mean()))
row("Table I row 7 v_m 0.14 read as 1.4", "pointB_over_vm_sd", float(obs_bad[keep].std(ddof=1)))
row("Table I row 7 v_m 0.14 read as 1.4", "inflection_over_pointB_mean",
    float((pred_bad[keep] / obs_bad[keep]).mean()))
row("Table I row 7 v_m 0.14 read as 1.4", "t1_worst_vm_vs_B_pct",
    float((abs(np.r_[t1.v_m_cc_per_g.to_numpy()[:6], 1.4, t1.v_m_cc_per_g.to_numpy()[7:]]
               - t1.point_B_cc_per_g.to_numpy()) / t1.point_B_cc_per_g.to_numpy()).max() * 100))
row("butane row put back in (the authors exclude it)", "pointB_over_vm_mean",
    float(obs.mean()))
row("butane row put back in (the authors exclude it)", "inflection_over_pointB_mean",
    float((pred / obs).mean()))
row("Table III butane point B 28.1 read as 58.1", "t3_butane_vm_over_B", 58.2 / 58.1)

# ---- 6. the single-point rule
row("window taken at x = 0.05 instead of 1/3", "single_point_c_threshold",
    (1 - EPS) * (1 - 0.05) / (EPS * 0.05))
row("tolerance taken as 1 % instead of 5 %", "single_point_c_threshold",
    (1 - 0.01) * (1 - X_760) / (0.01 * X_760))
row("window taken at x = 0.05 instead of 1/3", "single_point_worst_underestimate_pct",
    float(((1 - shortcut_ratio(c_t1, 0.05)) * 100).max()))
row("R taken as 8.314 (J) instead of 1.9872 (cal)", "t1_min_reconstructed_c",
    float(np.exp(t1.E1_minus_EL_cal_per_mol.to_numpy(float) / (8.314 * T_TABLE1)).min()))
row("R taken as 8.314 (J) instead of 1.9872 (cal)", "single_point_worst_underestimate_pct",
    float(((1 - shortcut_ratio(np.exp(t1.E1_minus_EL_cal_per_mol.to_numpy(float)
                                      / (8.314 * T_TABLE1)), X_760)) * 100).max()))

# ---- 7. the band convention
t2_bad = t2.copy()
t2_bad.loc[(t2_bad.gas == "CO2") & (t2_bad.substance == "Silica gel"),
           "E1_minus_EL_cal_per_mol"] = 1385                    # 1335 -> 1385
rows_b = []
for g, kc, kh in [("N2", "t2_N2_centre", "t2_N2_half"), ("A", "t2_A_centre", "t2_A_half"),
                  ("CO2", "t2_CO2_centre", "t2_CO2_half"),
                  ("C4H10", "t2_C4H10_centre", "t2_C4H10_half")]:
    m, h = band(t2_bad.loc[t2_bad.gas == g, "E1_minus_EL_cal_per_mol"].to_numpy(float))
    rows_b.append((abs(m - P[kc]), abs(h - P[kh])))
row("Table II CO2 silica 1335 -> 1385", "t2_band_centre_max_dev_cal", max(r[0] for r in rows_b))
row("Table II CO2 silica 1335 -> 1385", "t2_band_half_max_dev_cal", max(r[1] for r in rows_b))
E_bad = E_T1.copy(); E_bad[9] = 838.0                            # 738 -> 838
row("Table I Cr2O3 gel 738 -> 838", "t1_band_twelve_row_half_cal", band(E_bad)[1])
row("Table I Cr2O3 gel 738 -> 838", "t1_rows_outside_printed_band",
    float((np.abs(E_bad - P["t1_N2_band_centre"]) > P["t1_N2_band_half"]).sum()))
row("catalyst 931 omitted instead of Cr2O3 gel", "t1_band_eleven_row_centre_cal",
    band(np.delete(E_T1, 4))[0])
row("catalyst 931 omitted instead of Cr2O3 gel", "t1_band_eleven_row_half_cal",
    band(np.delete(E_T1, 4))[1])
xchk_bad = TRANSCRIPTION_MAX_DEV + 0.0
row("Table III N2 -183 E1-EL 794 -> 749 (transposition)", "transcription_max_dev_cal",
    max(abs(794 - 749), TRANSCRIPTION_MAX_DEV))

# ---- 8. surfaces
S3s_bad = t3.surface_solid_m2_per_g.to_numpy(float).copy(); S3s_bad[6] = 405.0   # 504 -> 405
row("Table III butane solid surface 504 -> 405", "t3_solid_mean_m2g", spread(S3s_bad)[0])
S3l_bad = t3.surface_liquid_m2_per_g.to_numpy(float).copy(); S3l_bad[2] = 646.0  # 464 -> 646
row("Table III argon liquid surface 464 -> 646", "t3_liquid_maxdev_pct", spread(S3l_bad)[1])
row("Table III argon liquid surface 464 -> 646", "discrimination_factor_silica",
    T3_VM_DEV / spread(S3l_bad)[1])
row("butane row kept in the charcoal means (the paper drops it)", "t5_solid_mean_m2g",
    spread(t5.surface_solid_m2_per_g)[0])
row("butane row kept in the charcoal means (the paper drops it)", "t5_liquid_maxdev_pct",
    spread(t5.surface_liquid_m2_per_g)[1])
row("butane row kept in the charcoal means (the paper drops it)",
    "discrimination_factor_charcoal", spread(t5.v_m_cc_per_g)[1] / spread(t5.surface_liquid_m2_per_g)[1])
t5_bad = t5.copy(); t5_bad.loc[t5_bad.index[1], "v_m_cc_per_g"] = 137.0          # 173.0 -> 137.0
s5b = t5_bad.assign(sig_solid=sigma_A2(t5_bad.v_m_cc_per_g, t5_bad.surface_solid_m2_per_g),
                    sig_liquid=sigma_A2(t5_bad.v_m_cc_per_g, t5_bad.surface_liquid_m2_per_g))
mgb = s3.merge(s5b, on=["gas", "temperature_C"], suffixes=("_silica", "_charcoal"))
row("Table V N2 -183 v_m 173.0 -> 137.0 (transposition)", "sigma_cross_table_max_pct",
    float(max((mgb.sig_solid_silica / mgb.sig_solid_charcoal - 1).abs().max(),
              (mgb.sig_liquid_silica / mgb.sig_liquid_charcoal - 1).abs().max()) * 100))
row("BLIND SPOT: V_STP 22414 -> 24450 (a common factor, cancels in the ratio)",
    "sigma_cross_table_max_pct", SIGMA_CROSS_MAX)
mgb["env_liquid_%"] = rounding_envelope(mgb.v_m_cc_per_g_silica, mgb.surface_liquid_m2_per_g_silica,
                                        mgb.v_m_cc_per_g_charcoal, mgb.surface_liquid_m2_per_g_charcoal)
row("Table V N2 -183 v_m 173.0 -> 137.0 (transposition)", "sigma_cross_table_max_over_envelope",
    float(((mgb.sig_liquid_silica / mgb.sig_liquid_charcoal - 1).abs() * 100
           / mgb["env_liquid_%"]).max()))
row("surface columns assumed to carry one decimal, not to be integers",
    "sigma_cross_table_max_over_envelope",
    float(max((mg["dev_solid_%"] / rounding_envelope(
                   mg.v_m_cc_per_g_silica, mg.surface_solid_m2_per_g_silica * 10,
                   mg.v_m_cc_per_g_charcoal, mg.surface_solid_m2_per_g_charcoal * 10)).max(),
              (mg["dev_liquid_%"] / rounding_envelope(
                   mg.v_m_cc_per_g_silica, mg.surface_liquid_m2_per_g_silica * 10,
                   mg.v_m_cc_per_g_charcoal, mg.surface_liquid_m2_per_g_charcoal * 10)).max())))
row("tuned-sigma bound taken on the butane-INCLUSIVE seven shared pairs",
    "sigma_tuned_charcoal_spread_pct",
    spread(sh7.v_m_cc_per_g_c.to_numpy(float) / sh7.v_m_cc_per_g_s.to_numpy(float))[1])
row("tuned sigma taken as a constant instead of proportional to 1/v_m",
    "sigma_tuned_charcoal_spread_pct", spread(vm_c)[1])

# ---- 9. the remaining printed claims
VM4b = VM4.copy(); VM4b[-1] = 113.0                    # 131.0 -> 113.0
row("Table IV v_m(-80) 131.0 -> 113.0", "t4_vm_ratio", VM4b[-1] / VM4b[0])
DL4b = DL4.copy(); DL4b[-1] = 1.462                    # 1.642 -> 1.462
row("Table IV d_L(-80) 1.642 -> 1.462", "t4_dL_power_ratio", (DL4b[-1] / DL4b[0])**(2 / 3))
row("Table IV EL(0 C) 5840 -> 5480", "t4_E1_closure_max_cal",
    float(max(abs(7540 - 1705 - 5480), 1.0)))
row("Fig. 3 v_m 133.0 read as 138.0", "vm_temperature_extrapolation_pct",
    (P["fig4_N2_1958_vm"] / 138.0 - 1) * 100)
row("Fig. 4 E1-EL 900 read as 700", "c_two_routes_ratio_77K",
    P["fig3_c"] / float(np.exp(700 / (R_CAL * P["fig3_T"]))))
row("Palmer & Clark HF area 4690 -> 4960", "palmer_clark_ratio_liquid",
    P["pc_area_from_liquid"] / 4960.0)
row("Palmer & Clark HF area 4690 -> 4960", "palmer_clark_ratio_adam",
    P["pc_area_from_adam"] / 4960.0)
row("Fig. 3 sample mass 50.4 -> 54.0 g", "t1_954_two_places_pct",
    (vm954 * 54.0 / P["fig4_N2_183_vm"] - 1) * 100)
eqB_typo = (c * x / (1 - x) * (1 - n * x**n + n * x**(n + 1))
            / (1 + (c - 1) * x - c * x**(n + 1)))            # (n+1) mistyped as n
row("eq. (B) numerator (n+1) mistyped as n", "symbolic_identity_max_resid",
    float(abs(sp.N(sp.simplify(eqB_typo.subs(n, 1) - c * x / (1 + c * x))
                   .subs({x: sp.Rational(1, 3), c: 100})))))
row("eq. (28) denominator (p0 - p) mistyped as (p0 + p)", "symbolic_identity_max_resid",
    float(abs(sp.N(sp.simplify(p / ((vm * c * p / ((p0 + p) * (1 + (c - 1) * (p / p0)))) * (p0 - p))
                               - (1 / (vm * c) + (c - 1) / (vm * c) * p / p0))
                   .subs({p: sp.Rational(1, 3), p0: 1, c: 100, vm: 1})))))

bt = pd.DataFrame(BREAK, columns=["defect injected", "metric", "undamaged", "defected"])
bt["moves"] = np.where(np.isclose(bt.undamaged, bt.defected, rtol=1e-6, atol=1e-14)
                       | (bt.undamaged.isna() & bt.defected.isna()), "no", "YES")
pd.set_option("display.max_rows", 200)
display(bt.round(6))
print(f"\nrows: {len(bt)}   distinct metrics reached: {len(set(bt.metric))}   "
      f"rows that move their metric: {(bt.moves == 'YES').sum()}")
BREAK_METRICS = set(bt.metric)
SAMPLED vs ROOT-FOUND, the row 'What pymrm adds' item 3 quotes:
ceiling : sampled 1.1546960 root-found 1.1547005 -> 3.905e-06 relative,
first differing in the SIXTH significant figure (not the fourth).
c* : sampled 52.233451 root-found 52.980761 -> 1.4307 % high,
i.e. wrong by 1.4 PER CENT, not by a factor 1.4. The grid has a node at
52.2335 and the argmax lands on it. The maximum is quadratic,
so its LOCATION degrades far faster than its VALUE -- which is the point.
| defect injected | metric | undamaged | defected | moves | |
|---|---|---|---|---|---|
| 0 | lattice sums swapped: 8.823 - 8.357 | polar_lattice_net | -0.466000 | 0.466000 | YES |
| 1 | lattice sums swapped: 8.823 - 8.357 | polar_d_recomputed | -0.352523 | 0.352523 | YES |
| 2 | lattice sums swapped: 8.823 - 8.357 | polar_C_recomputed | -0.010223 | 0.010223 | YES |
| 3 | alpha/r^3 read as 0.29 (lost zero) | polar_C_recomputed | -0.010223 | -0.032031 | YES |
| 4 | alpha/r^3 read as 0.29 (lost zero) | polar_K1_recomputed | 0.000105 | 0.001026 | YES |
| 5 | alpha/r^3 read as 0.29 (lost zero) | C_factor_bradley_over_computed | 96.751242 | 30.879302 | YES |
| 6 | self-term 11.1 dropped from the denominator | polar_d_recomputed | -0.352523 | -0.466000 | YES |
| 7 | Bradley's k read as 0.0615 (misplaced point) | bradley_C_from_eq1c | 0.989104 | 0.061733 | YES |
| 8 | Bradley's k read as 0.0615 (misplaced point) | C_factor_bradley_over_computed | 96.751242 | 6.038590 | YES |
| 9 | Bradley's k read as 0.0615 (misplaced point) | energy_factor_bradley_over_computed | 9360.802777 | 36.464567 | YES |
| 10 | Bradley's k read as 0.0615 (misplaced point) | bradley_k_over_eq1b_limit | 1.230000 | 0.123000 | YES |
| 11 | eq. (1c) used where (1b) belongs | ladder_vs_eq1b_reldev | 0.000000 | 0.000000 | YES |
| 12 | ladder built with the mu_{i+1} coupling dropped | ladder_vs_eq1b_reldev | 0.000000 | 0.000105 | YES |
| 13 | truncation spread read at the physical k inste... | ladder_truncation_spread_bradley | 4.482430 | 0.000000 | YES |
| 14 | ladder run at Bradley's k instead of the physi... | ladder_truncation_spread_physical | 0.000000 | 4.482430 | YES |
| 15 | n = 4 used as the reference branch at x = 0.58 | eqB_n6_over_n5_at_058_pct | 5.620598 | 14.639582 | YES |
| 16 | n = 8 used as the reference branch at x = 0.72 | eqB_n6_over_n7_at_072_pct | -6.846421 | -11.835319 | YES |
| 17 | eq. (A) used where eq. (B) at n = 6 belongs | eqB_n6_over_n5_at_058_pct | 5.620598 | 17.342340 | YES |
| 18 | Fig. 3's c misread as 15.67 | eqB_n6_over_n5_at_058_pct | 5.620598 | 5.748522 | YES |
| 19 | Fig. 3's c misread as 15.67 | eqB_n_from_058 | 5.870639 | 5.847870 | YES |
| 20 | target set to +7 % instead of +5 % at x = 0.58 | eqB_n_from_058 | 5.870639 | 6.311284 | YES |
| 21 | target set to -5 % instead of -7 % at x = 0.72 | eqB_n_from_072 | 5.979547 | 6.252024 | YES |
| 22 | eq. (B) numerator (n+1) mistyped as n | ladder_vs_eqB_max_reldev | 0.000000 | 0.730454 | YES |
| 23 | ladder compared against the n+1 branch | ladder_vs_eqB_max_reldev | 0.000000 | 0.206139 | YES |
| 24 | ladder run at c 1 % high | ladder_vs_eqB_max_reldev | 0.000000 | 0.001074 | YES |
| 25 | BLIND SPOT: ladder layer count 5 -> 60 (exact ... | ladder_vs_eqB_max_reldev | 0.000000 | 0.000000 | no |
| 26 | eq. (26) denominator (1-x+cx) -> (1+x+cx) | bet_inflection_ceiling | 1.154701 | NaN | YES |
| 27 | ceiling read at c = 25 instead of maximised ov... | bet_inflection_ceiling | 1.154701 | 1.137433 | YES |
| 28 | ceiling maximum SAMPLED on a 40-point log grid... | bet_inflection_ceiling | 1.154701 | 1.154696 | YES |
| 29 | ceiling maximum sampled on a 40-point log grid | c_at_inflection_ceiling | 52.980761 | 52.233451 | YES |
| 30 | ceiling compared against 2/sqrt(2) instead of ... | bet_inflection_ceiling_two_route_reldev | 0.000000 | 0.183503 | YES |
| 31 | STRUCTURAL, cannot move: every reconstructed c... | bet_inflection_ceiling | 1.154701 | 1.154701 | no |
| 32 | every reconstructed c scaled by the Fig.3/Fig.... | single_point_worst_underestimate_pct | 3.141101 | 6.760699 | YES |
| 33 | every reconstructed c scaled by the Fig.3/Fig.... | t1_min_reconstructed_c | 61.671950 | 27.582739 | YES |
| 34 | every reconstructed c scaled by the Fig.3/Fig.... | inflection_over_pointB_mean | 1.148812 | 1.140158 | YES |
| 35 | the scaled-c sensitivity run at prefactor 1 (i... | single_point_worst_underestimate_scaled_pct | 6.760699 | 3.141101 | YES |
| 36 | the scaled-c sensitivity run at prefactor 1 (i... | t1_min_reconstructed_c_scaled | 27.582739 | 61.671950 | YES |
| 37 | Fig. 3's c misread as 15.67 | c_two_routes_ratio_77K | 0.447249 | 0.044725 | YES |
| 38 | Table I row 7 v_m 0.14 read as 1.4 | pointB_over_vm_mean | 1.002871 | 0.960014 | YES |
| 39 | Table I row 7 v_m 0.14 read as 1.4 | pointB_over_vm_sd | 0.072025 | 0.226880 | YES |
| 40 | Table I row 7 v_m 0.14 read as 1.4 | inflection_over_pointB_mean | 1.148812 | 1.821069 | YES |
| 41 | Table I row 7 v_m 0.14 read as 1.4 | t1_worst_vm_vs_B_pct | 16.666667 | 1066.666667 | YES |
| 42 | butane row put back in (the authors exclude it) | pointB_over_vm_mean | 1.002871 | 0.975500 | YES |
| 43 | butane row put back in (the authors exclude it) | inflection_over_pointB_mean | 1.148812 | 1.213726 | YES |
| 44 | Table III butane point B 28.1 read as 58.1 | t3_butane_vm_over_B | 2.071174 | 1.001721 | YES |
| 45 | window taken at x = 0.05 instead of 1/3 | single_point_c_threshold | 38.000000 | 361.000000 | YES |
| 46 | tolerance taken as 1 % instead of 5 % | single_point_c_threshold | 38.000000 | 198.000000 | YES |
| 47 | window taken at x = 0.05 instead of 1/3 | single_point_worst_underestimate_pct | 3.141101 | 23.552176 | YES |
| 48 | R taken as 8.314 (J) instead of 1.9872 (cal) | t1_min_reconstructed_c | 61.671950 | 2.678330 | YES |
| 49 | R taken as 8.314 (J) instead of 1.9872 (cal) | single_point_worst_underestimate_pct | 3.141101 | 42.750296 | YES |
| 50 | Table II CO2 silica 1335 -> 1385 | t2_band_centre_max_dev_cal | 4.000000 | 22.500000 | YES |
| 51 | Table II CO2 silica 1335 -> 1385 | t2_band_half_max_dev_cal | 2.500000 | 22.500000 | YES |
| 52 | Table I Cr2O3 gel 738 -> 838 | t1_band_twelve_row_half_cal | 86.500000 | 69.500000 | YES |
| 53 | Table I Cr2O3 gel 738 -> 838 | t1_rows_outside_printed_band | 2.000000 | 1.000000 | YES |
| 54 | catalyst 931 omitted instead of Cr2O3 gel | t1_band_eleven_row_centre_cal | 841.500000 | 816.000000 | YES |
| 55 | catalyst 931 omitted instead of Cr2O3 gel | t1_band_eleven_row_half_cal | 69.500000 | 78.000000 | YES |
| 56 | Table III N2 -183 E1-EL 794 -> 749 (transposit... | transcription_max_dev_cal | 0.000000 | 45.000000 | YES |
| 57 | Table III butane solid surface 504 -> 405 | t3_solid_mean_m2g | 437.857143 | 423.714286 | YES |
| 58 | Table III argon liquid surface 464 -> 646 | t3_liquid_maxdev_pct | 10.609481 | 21.363392 | YES |
| 59 | Table III argon liquid surface 464 -> 646 | discrimination_factor_silica | 4.418410 | 2.194269 | YES |
| 60 | butane row kept in the charcoal means (the pap... | t5_solid_mean_m2g | 707.714286 | 687.375000 | YES |
| 61 | butane row kept in the charcoal means (the pap... | t5_liquid_maxdev_pct | 7.896552 | 31.169240 | YES |
| 62 | butane row kept in the charcoal means (the pap... | discrimination_factor_charcoal | 2.350626 | 2.091670 | YES |
| 63 | Table V N2 -183 v_m 173.0 -> 137.0 (transposit... | sigma_cross_table_max_pct | 0.663085 | 20.806677 | YES |
| 64 | BLIND SPOT: V_STP 22414 -> 24450 (a common fac... | sigma_cross_table_max_pct | 0.663085 | 0.663085 | no |
| 65 | Table V N2 -183 v_m 173.0 -> 137.0 (transposit... | sigma_cross_table_max_over_envelope | 3.000465 | 88.144594 | YES |
| 66 | surface columns assumed to carry one decimal, ... | sigma_cross_table_max_over_envelope | 3.000465 | 7.865982 | YES |
| 67 | tuned-sigma bound taken on the butane-INCLUSIV... | sigma_tuned_charcoal_spread_pct | 14.378620 | 31.282664 | YES |
| 68 | tuned sigma taken as a constant instead of pro... | sigma_tuned_charcoal_spread_pct | 14.378620 | 20.348837 | YES |
| 69 | Table IV v_m(-80) 131.0 -> 113.0 | t4_vm_ratio | 1.430131 | 1.233624 | YES |
| 70 | Table IV d_L(-80) 1.642 -> 1.462 | t4_dL_power_ratio | 1.152572 | 1.066721 | YES |
| 71 | Table IV EL(0 C) 5840 -> 5480 | t4_E1_closure_max_cal | 5.000000 | 355.000000 | YES |
| 72 | Fig. 3 v_m 133.0 read as 138.0 | vm_temperature_extrapolation_pct | -2.255639 | -5.797101 | YES |
| 73 | Fig. 4 E1-EL 900 read as 700 | c_two_routes_ratio_77K | 0.447249 | 1.644366 | YES |
| 74 | Palmer & Clark HF area 4690 -> 4960 | palmer_clark_ratio_liquid | 1.202559 | 1.137097 | YES |
| 75 | Palmer & Clark HF area 4690 -> 4960 | palmer_clark_ratio_adam | 0.914712 | 0.864919 | YES |
| 76 | Fig. 3 sample mass 50.4 -> 54.0 g | t1_954_two_places_pct | 15.592622 | 23.849238 | YES |
| 77 | eq. (B) numerator (n+1) mistyped as n | symbolic_identity_max_resid | 0.000000 | 0.728155 | YES |
| 78 | eq. (28) denominator (p0 - p) mistyped as (p0 ... | symbolic_identity_max_resid | 0.000000 | 0.340000 | YES |
rows: 79 distinct metrics reached: 54 rows that move their metric: 76Metrics
Reported to agreement.json, with the coverage map asserted against it key-for-key and every below-floor metric named beside its above-floor companion.
metrics = dict(UND)
report_agreement("J1.3", metrics)

FLOOR = 1e-12
below = sorted(k for k, v in metrics.items() if abs(float(v)) < FLOOR)
companions = {
    "symbolic_identity_max_resid": "eqB_n6_over_n5_at_058_pct and ladder_vs_eqB_max_reldev "
                                   "-- the same equations evaluated numerically on every branch",
    "ladder_vs_eqB_max_reldev": "eqB_n6_over_n5_at_058_pct -- the same ladder's numbers, above floor",
    "bet_inflection_ceiling_two_route_reldev": "bet_inflection_ceiling itself and "
                                               "c_at_inflection_ceiling, both above floor",
    "ladder_vs_eq1b_reldev": "ladder_truncation_spread_bradley -- the same ladder at the k "
                             "where it has no fixed point, and the load-bearing number anyway",
    "ladder_truncation_spread_physical": "ladder_truncation_spread_bradley -- the SAME sweep at "
                                         "the k where it does NOT settle. Exactly zero here is the "
                                         "result (the decay ratio does not depend on where the "
                                         "ladder is cut), and the contrast is the evidence",
    "transcription_max_dev_cal": "sigma_cross_table_max_pct -- a cross-table consistency check of "
                                 "the same kind, above floor. Exactly zero here is not luck: five "
                                 "cells printed twice in the paper are integers and agree, so "
                                 "there is no scale for round-off to appear on",
}
print(f"\nMETRICS BELOW check_agreement.py's ABS_FLOOR = {FLOOR:g}, which CI does NOT compare.")
print("Each is an identity between two correct routes; each has an above-floor companion:")
for k in below:
    print(f"   {k} = {metrics[k]:.4g}")
    print(f"       companion: {companions.get(k, 'MISSING -- fix this')}")

print("\nDELIBERATELY NOT REPORTED AS METRICS (each would manufacture CI regressions):")
print(f"   single_point_threshold_two_route_reldev = "
      f"{abs(C_THRESH_ROOT/C_THRESH_CLOSED-1):.3e} -- round-off between a closed form")
print("       and a bracketing root-find; the agreement is the evidence, its digits are not.")
print(f"   c_star_two_route_reldev                 = "
      f"{abs(C_STAR_NUM/float(sp.N(C_STAR_SYM))-1):.3e} -- set by the finite-difference")
print("       step in the outer root-find, not by anything about the physics.")
print(f"   pymrm Newton iteration counts           = "
      f"{sorted(set(branch['Newton its']))} -- solver bookkeeping.")

uncovered = sorted(set(metrics) - BREAK_METRICS)
print(f"\nBREAK-TABLE COVERAGE: {len(metrics)} metrics reported, "
      f"{len(metrics)-len(uncovered)} have at least one row that moves them.")
why = {
    "energy_factor_bradley_over_computed": None,
    "ladder_truncation_spread_physical": None,
    "eqB_n_from_072": None,
    "pointB_over_vm_sd": None,
    "t1_band_eleven_row_half_cal": None,
    "t3_liquid_maxdev_pct": None,
    "t5_liquid_maxdev_pct": None,
}
if uncovered:
    print("The remainder, and why no row reaches them:")
    for k in uncovered:
        print(f"   {k}: {why.get(k) or 'UNEXPLAINED -- fix this'}")
else:
    print("Every reported metric has a break row that moves it.")

still = sorted(m for m in BREAK_METRICS
               if not (bt[(bt.metric == m) & (bt.moves == "YES")].shape[0]))
print(f"\nMetrics that HAVE rows but which no row MOVES: {still if still else 'none'}")
for m in still:
    print(f"   {m}: the rows for it are the declared blind spots above "
          f"(exact at every n / holds for all c / both tables perturbed together)")
Agreement metrics for J1.3:
polar_d_recomputed = -0.35252
polar_C_recomputed = -0.010223
polar_K1_recomputed = 0.00010451
polar_lattice_net = -0.466
bradley_C_from_eq1c = 0.9891
C_factor_bradley_over_computed = 96.751
energy_factor_bradley_over_computed = 9360.8
bradley_k_over_eq1b_limit = 1.23
ladder_vs_eq1b_reldev = 8.5043e-14
ladder_truncation_spread_bradley = 4.4824
ladder_truncation_spread_physical = 0
symbolic_identity_max_resid = 0
eqB_n6_over_n5_at_058_pct = 5.6206
eqB_n6_over_n7_at_072_pct = -6.8464
eqB_n_from_058 = 5.8706
eqB_n_from_072 = 5.9795
ladder_vs_eqB_max_reldev = 6.6613e-16
bet_inflection_ceiling = 1.1547
bet_inflection_ceiling_two_route_reldev = 0
c_at_inflection_ceiling = 52.981
pointB_over_vm_mean = 1.0029
pointB_over_vm_sd = 0.072025
inflection_over_pointB_mean = 1.1488
t1_worst_vm_vs_B_pct = 16.667
t3_butane_vm_over_B = 2.0712
single_point_c_threshold = 38
single_point_worst_underestimate_pct = 3.1411
t1_min_reconstructed_c = 61.672
t2_band_centre_max_dev_cal = 4
t2_band_half_max_dev_cal = 2.5
t1_band_twelve_row_half_cal = 86.5
t1_band_eleven_row_centre_cal = 841.5
t1_band_eleven_row_half_cal = 69.5
t1_rows_outside_printed_band = 2
t3_solid_mean_m2g = 437.86
t3_liquid_maxdev_pct = 10.609
t5_solid_mean_m2g = 707.71
t5_liquid_maxdev_pct = 7.8966
sigma_cross_table_max_pct = 0.66308
discrimination_factor_silica = 4.4184
discrimination_factor_charcoal = 2.3506
t4_vm_ratio = 1.4301
t4_dL_power_ratio = 1.1526
t4_E1_closure_max_cal = 5
vm_temperature_extrapolation_pct = -2.2556
c_two_routes_ratio_77K = 0.44725
single_point_worst_underestimate_scaled_pct = 6.7607
t1_min_reconstructed_c_scaled = 27.583
sigma_cross_table_max_over_envelope = 3.0005
sigma_tuned_charcoal_spread_pct = 14.379
palmer_clark_ratio_liquid = 1.2026
palmer_clark_ratio_adam = 0.91471
t1_954_two_places_pct = 15.593
transcription_max_dev_cal = 0
METRICS BELOW check_agreement.py's ABS_FLOOR = 1e-12, which CI does NOT compare.
Each is an identity between two correct routes; each has an above-floor companion:
bet_inflection_ceiling_two_route_reldev = 0
companion: bet_inflection_ceiling itself and c_at_inflection_ceiling, both above floor
ladder_truncation_spread_physical = 0
companion: ladder_truncation_spread_bradley -- the SAME sweep at the k where it does NOT settle. Exactly zero here is the result (the decay ratio does not depend on where the ladder is cut), and the contrast is the evidence
ladder_vs_eq1b_reldev = 8.504e-14
companion: ladder_truncation_spread_bradley -- the same ladder at the k where it has no fixed point, and the load-bearing number anyway
ladder_vs_eqB_max_reldev = 6.661e-16
companion: eqB_n6_over_n5_at_058_pct -- the same ladder's numbers, above floor
symbolic_identity_max_resid = 0
companion: eqB_n6_over_n5_at_058_pct and ladder_vs_eqB_max_reldev -- the same equations evaluated numerically on every branch
transcription_max_dev_cal = 0
companion: sigma_cross_table_max_pct -- a cross-table consistency check of the same kind, above floor. Exactly zero here is not luck: five cells printed twice in the paper are integers and agree, so there is no scale for round-off to appear on
DELIBERATELY NOT REPORTED AS METRICS (each would manufacture CI regressions):
single_point_threshold_two_route_reldev = 2.776e-15 -- round-off between a closed form
and a bracketing root-find; the agreement is the evidence, its digits are not.
c_star_two_route_reldev = 1.207e-08 -- set by the finite-difference
step in the outer root-find, not by anything about the physics.
pymrm Newton iteration counts = [1, 2, 3] -- solver bookkeeping.
BREAK-TABLE COVERAGE: 54 metrics reported, 54 have at least one row that moves them.
Every reported metric has a break row that moves it.
Metrics that HAVE rows but which no row MOVES: noneProse audit
Every number stated in this page’s prose is re-derived here and compared against the value the cells printed. The cell raises if any of them drift, so the markdown cannot fall out of step with the output.
PROSE = {
    "C computed":                 (abs(C_POL), 0.0102, 3e-3),
    "C from Bradley's k":         (C_BRAD, 0.989, 1e-3),
    "factor in C":                (C_FACTOR, 96.8, 1e-3),
    "factor in energy":           (E_FACTOR, 9361.0, 1e-3),
    "Bradley k / limit":          (K_LIMIT_RATIO, 1.23, 1e-3),
    "inflection ceiling":         (CEIL_NUM, 1.1547, 1e-4),
    "c at the ceiling":           (C_STAR_NUM, 27 + 15 * np.sqrt(3), 1e-6),
    "v_m spread, silica":         (T3_VM_DEV, 46.9, 2e-3),
    "area spread, silica":        (T3_LIQ_DEV, 10.6, 2e-3),
    "v_m spread, charcoal":       (T5_VM_DEV, 18.6, 3e-3),
    "area spread, charcoal":      (T5_LIQ_DEV, 7.9, 2e-3),
    "eq (B) at x=0.58":           (ERR_058, 5.62, 2e-3),
    "eq (B) at x=0.72":           (ERR_072, -6.85, 2e-3),
    "single-point threshold":     (C_THRESH_CLOSED, 38.0, 1e-9),
    "single-point worst":         (SHORT_WORST, 3.14, 2e-3),
    "c two routes, 77.3 K":       (C_TWO_ROUTE, 0.4472, 2e-3),
    "c two routes, as a factor":  (1 / C_TWO_ROUTE, 2.24, 2e-3),
    "954 c from Table I":         (C_T1_954, 147.4, 1e-3),
    "E from Fig. 3's fitted c":   (E_from_c, 776.4, 1e-4),
    "E rounding cost in c, %":    (0.5 / (R_CAL * T_TABLE1) * 100, 0.28, 1e-2),
    "scaled-c worst underest.":   (SHORT_WORST_SCALED, 6.76, 2e-3),
    "scaled-c smallest c":        (C_T1_MIN_SCALED, 27.58, 1e-3),
    "scaled-c rows past 5 %":     (float(T1_ROWS_BREACHING_SCALED), 7.0, 1e-9),
    "temperature extrapolation":  (VM_TEMP_DEV, -2.26, 3e-3),
    "inflection above point B":   (INFL_ABOVE_B, 14.881, 3e-4),
    "point B below inflection":   (PB_BELOW_INFL, 12.95, 3e-3),
    "butane point B / v_m":       (float(obs.min()), 0.4828, 3e-4),
    "butane below v_m, %":        ((1 - float(obs.min())) * 100, 51.7, 3e-3),
    "T1 worst v_m vs B":          (T1_WORST_VM_B, 16.7, 2e-3),
    "sigma cross-table worst":    (SIGMA_CROSS_MAX, 0.66, 1e-2),
    "sigma CO liquid envelope":   (float(SIG_WORST_ROW["env_liquid_%"]), 0.221, 3e-3),
    "sigma worst over envelope":  (SIGMA_OVER_ENVELOPE, 3.0, 2e-2),
    "tuned-sigma charcoal":       (SIGMA_TUNED_CHARCOAL, 14.4, 3e-3),
    "tuned-sigma printed, 6 rows": (SIGMA_PRINTED_CHARCOAL_6, 7.37, 3e-3),
    "tuned-sigma power factor":   (SIGMA_TUNED_POWER, 1.95, 5e-3),
    "grid-sampled ceiling":       (CEIL_SAMPLED, 1.1546960, 1e-6),
    "grid-sampled ceiling reldev": (CEIL_SAMPLED_RELDEV * 1e6, 3.905, 2e-3),
    "grid-sampled c*":            (C_STAR_SAMPLED, 52.2335, 1e-5),
    "grid-sampled c* error, %":   (C_STAR_SAMPLED_PCT, 1.43, 3e-3),
    "T2 argon printed half":      (P["t2_A_half"], 55.0, 1e-9),
    "break rows":                 (float(len(bt)), 79.0, 1e-9),
    "break rows that move":       (float((bt.moves == "YES").sum()), 76.0, 1e-9),
    "twelve-row band centre":     (MID12, 824.5, 1e-9),
    "twelve-row band half":       (HALF12, 86.5, 1e-9),
    "eleven-row band centre":     (MID11, 841.5, 1e-9),
    "eleven-row band half":       (HALF11, 69.5, 1e-9),
    "rows outside the band":      (float(T1_ROWS_OUTSIDE), 2.0, 1e-9),
    "954 two places":             (T1_954_DEV, 15.6, 1e-2),
    "T4 v_m ratio":               (T4_VM_RATIO, 1.43, 1e-3),
    "T4 d_L^(2/3) ratio":         (T4_DL_RATIO, 1.15, 3e-3),
    "Palmer & Clark, liquid":     ((PC_LIQUID - 1) * 100, 20.3, 5e-3),
    "Palmer & Clark, Adam":       ((PC_ADAM - 1) * 100, -8.5, 5e-3),
    "ceiling, in per cent":       ((CEIL_EXACT - 1) * 100, 15.5, 3e-3),
}
bad = []
for k, (computed, in_prose, rtol) in PROSE.items():
    ok = abs(float(computed) - in_prose) <= rtol * max(1.0, abs(in_prose))
    print(f"  {'ok ' if ok else 'FAIL'}  {k:28s} computed {float(computed):14.6f}   "
          f"prose {in_prose:12.4f}")
    if not ok:
        bad.append(k)
assert not bad, f"prose and output disagree on: {bad}"
print(f"\nall {len(PROSE)} numbers stated in the prose match what the cells printed")
ok C computed computed 0.010223 prose 0.0102
ok C from Bradley's k computed 0.989104 prose 0.9890
ok factor in C computed 96.751242 prose 96.8000
ok factor in energy computed 9360.802777 prose 9361.0000
ok Bradley k / limit computed 1.230000 prose 1.2300
ok inflection ceiling computed 1.154701 prose 1.1547
ok c at the ceiling computed 52.980761 prose 52.9808
ok v_m spread, silica computed 46.877037 prose 46.9000
ok area spread, silica computed 10.609481 prose 10.6000
ok v_m spread, charcoal computed 18.561837 prose 18.6000
ok area spread, charcoal computed 7.896552 prose 7.9000
ok eq (B) at x=0.58 computed 5.620598 prose 5.6200
ok eq (B) at x=0.72 computed -6.846421 prose -6.8500
ok single-point threshold computed 38.000000 prose 38.0000
ok single-point worst computed 3.141101 prose 3.1400
ok c two routes, 77.3 K computed 0.447249 prose 0.4472
ok c two routes, as a factor computed 2.235889 prose 2.2400
ok 954 c from Table I computed 147.394133 prose 147.4000
ok E from Fig. 3's fitted c computed 776.398946 prose 776.4000
ok E rounding cost in c, % computed 0.279257 prose 0.2800
ok scaled-c worst underest. computed 6.760699 prose 6.7600
ok scaled-c smallest c computed 27.582739 prose 27.5800
ok scaled-c rows past 5 % computed 7.000000 prose 7.0000
ok temperature extrapolation computed -2.255639 prose -2.2600
ok inflection above point B computed 14.881199 prose 14.8810
ok point B below inflection computed 12.953555 prose 12.9500
ok butane point B / v_m computed 0.482818 prose 0.4828
ok butane below v_m, % computed 51.718213 prose 51.7000
ok T1 worst v_m vs B computed 16.666667 prose 16.7000
ok sigma cross-table worst computed 0.663085 prose 0.6600
ok sigma CO liquid envelope computed 0.220994 prose 0.2210
ok sigma worst over envelope computed 3.000465 prose 3.0000
ok tuned-sigma charcoal computed 14.378620 prose 14.4000
ok tuned-sigma printed, 6 rows computed 7.365893 prose 7.3700
ok tuned-sigma power factor computed 1.952054 prose 1.9500
ok grid-sampled ceiling computed 1.154696 prose 1.1547
ok grid-sampled ceiling reldev computed 3.905054 prose 3.9050
ok grid-sampled c* computed 52.233451 prose 52.2335
ok grid-sampled c* error, % computed 1.430713 prose 1.4300
ok T2 argon printed half computed 55.000000 prose 55.0000
ok break rows computed 79.000000 prose 79.0000
ok break rows that move computed 76.000000 prose 76.0000
ok twelve-row band centre computed 824.500000 prose 824.5000
ok twelve-row band half computed 86.500000 prose 86.5000
ok eleven-row band centre computed 841.500000 prose 841.5000
ok eleven-row band half computed 69.500000 prose 69.5000
ok rows outside the band computed 2.000000 prose 2.0000
ok 954 two places computed 15.592622 prose 15.6000
ok T4 v_m ratio computed 1.430131 prose 1.4300
ok T4 d_L^(2/3) ratio computed 1.152572 prose 1.1500
ok Palmer & Clark, liquid computed 20.255864 prose 20.3000
ok Palmer & Clark, Adam computed -8.528785 prose -8.5000
ok ceiling, in per cent computed 15.470054 prose 15.5000
all 53 numbers stated in the prose match what the cells printedWhat pymrm adds
Nothing to the BET equation, and the page says so where a reader would expect a solver. Equations (26), (28), (A), (B) and (E) are closed forms; the whole of sections 1, 3, 5, 6, 7, 8 and 9 would run with pymrm uninstalled, exactly as on A1.6 and A1.1. There is no grid, no time step and no transport on this page. What newton and NumJac are doing here is real but narrow, and it is four things.
1. A route to the isotherm that shares no algebra with the isotherm. Eq. (B) is two geometric series summed by hand in 1938. Solving the layer equilibria (10)–(12) for the occupancies and forming eq. (15)’s sums term by term is a different computation with the same answer — and it catches a wrong closed form: mistyping the \((n+1)\) in eq. (B)’s numerator as \(n\) moves the agreement from \(6.7\times10^{-16}\) to a percent-level disagreement, which is the break row that gives this check its power. Exercised on every branch the paper uses, \(n = 1, 2, 5, 6, 7\) and \(n\to\infty\), at four relative pressures.
2. The same treatment applied to the rival theory, which is the point. The polarization theory’s closed form (1b) is quoted by BET from a paper nobody here has read. Assembling the recursion (1a) and measuring the decay ratio off the solution removes that dependence entirely — and it does something the closed form cannot: at \(k > 1/2\) it shows what goes wrong, the moments oscillating and the answer depending on where the ladder is cut. Eq. (1b) merely returns a complex number.
3. Root-finds where a sweep would have been wrong. The inflection point, the \(c\) that maximises it, the \(c\) at which the single-point rule reaches exactly 5 %, and the continuous \(n\) behind each printed percentage. The break table carries the row that shows this matters, and the honest size of it is printed there: sampling the ceiling on a 40-point log grid instead of root-finding it moves the ceiling only in the sixth significant figure (1.1546960 against 1.1547005, \(3.9\times10^{-6}\) relative) but moves \(c^\ast\) by 1.43 % (52.2335 against 52.9808, because the grid has a node at 52.2335). The ceiling is quadratic at its maximum, which is exactly why the location degrades a thousandfold faster than the value — and it is the location a reader would quote.
4. And one thing that is not pymrm at all, and is the most useful output on the page: the inflection ceiling. \(2/\sqrt3\) is not in the 1938 paper and, as far as this page’s reading goes, is not implied anywhere in it. It converts the authors’ strongest-looking corroboration — \(v_\mathrm{m}\) agreeing with point B, a claim journal page 315 makes about the twelve isotherms of Table I (“the two seldom differing by as much as 10 %”), and which this page extends to the eighteen non-butane pairs of Tables I and III — into a statement about the shape of their equation, and it needed a Lagrange condition and a root-find, not a solver. One-sidedly: it caps how far the knee can sit above \(v_\mathrm{m}\), not below.
Reuse
Use this page for the BET equation itself, its finite-layer form (B), the Langmuir/(E) limit, and — the part that is not in the textbooks — an honest account of what a BET plot does and does not establish.
The equation, ready to lift. v_over_vm_A(x, c) is eq. (26)/(A); v_eqB(x, c, n, vm) is eq. (B) and is correct at \(n = 1\) (Langmuir), at non-integer \(n\) (Table IV uses 3.5) and in the limit; ladder_v_over_vm is the independent route and is the one to copy if you are extending the model, because adding a layer-dependent energy means editing one residual line rather than re-deriving a series.
Four things to carry away, in the order they will save you time.
- A BET plot’s agreement inside \(0.05<p/p_0<0.35\) is a fit. Two parameters over a fifth of the range. Report it as a fit. The 1938 paper does not lean on it either — its evidence is the consistency between gases, which is a different and much stronger thing.
- \(v_\mathrm{m}\) agreeing with point B is weak corroboration — from above. The BET isotherm’s inflection sits at \(\le 2/\sqrt3\,v_\mathrm{m} = 1.155\,v_\mathrm{m}\) for every \(c\), so an eye-read knee at or below the inflection cannot be high by more than 15.5 %. It can be arbitrarily low: the bound is one-sided, and on this paper’s own butane isotherm (Table III) point B is 52 % below \(v_\mathrm{m}\). If you are validating a surface-area method, this is not the check to use — and if you quote the ceiling, quote it one-sidedly.
- The single-point (one-pressure) BET shortcut has an exact condition: \(c \ge (1-\varepsilon)(1-x)/(\varepsilon x)\), i.e. \(c \ge 38\) for 5 % at \(p/p_0 = 1/3\), and it can only underestimate \(v_\mathrm{m}\). Nitrogen at 90 K on the adsorbents of Table I passes on the paper’s own numbers; argon, oxygen, CO₂ and butane on the silica gel of Table III — four of its seven isotherms — do not, which is why the authors scoped the sentence to nitrogen. Do not read the Table I margin as robust: section 8 shows that a \(c\) scaled by the factor the paper’s own two routes disagree over puts seven of the twelve rows past 5 % and the smallest \(c\) below the threshold.
- \(E_1-E_\mathrm{L}\) is not an independent datum — it is \(c\), re-expressed. Journal page 313 says the energies were obtained from \(c\) through footnote 16 with the prefactor set to 1, so converting back returns the authors’ fit and nothing more, and the prefactor cannot be measured from this paper at all. What the paper does show is one isotherm carrying two \(c\) a factor 2.24 apart (Fig. 3 fitted against Fig. 4 calculated); treat that, not the four figures a printed \(c\) suggests, as the size of the doubt.
Do not use this page for anything dynamic. Adsorption breakthrough is J1.5; the linear-driving-force rate law and the column mass balance live there, and a BET equilibrium can be dropped into that page’s isotherm slot. Nothing here is a rate.
Do not use this page as a source on the polarization theory. De Boer and Zwicker (1929), de Boer (1931, 1932), and Bradley (1936) are all read through this paper’s restatement of them and none was consulted. What the page shows is that the theory as Brunauer, Emmett and Teller state it cannot carry the binding energy Bradley’s fitted \(k\) assigns it. If you need to cite the polarization theory, go to the originals.
References
Brunauer, S., Emmett, P. H. and Teller, E. (1938). Adsorption of gases in multimolecular layers. Journal of the American Chemical Society 60(2), 309–319. doi:10.1021/ja01269a023 — the paper, and the only document read. Received November 19, 1937. Identity confirmed from its own title page on a native-resolution render: the running head “Feb., 1938 … 309”, the contribution line “[Contribution from the Bureau of Chemistry and Soils and George Washington University]”, the title and the by-line “By Stephen Brunauer, P. H. Emmett and Edward Teller”. Equations (1)–(28), (A), (B), (C), (D), (E), footnotes 3, 10, 16 and 18, Tables I–V and the typeset constant blocks inside Figs. 3, 4 and 6 were all transcribed from renders at the scan’s native 300 ppi, each numeric cropped and re-read at that resolution.
Cited by the paper, not consulted, and nothing here derives from them.
de Boer, J. H. and Zwicker, C. (1929). Z. physik. Chem. B3, 407; de Boer, J. H. (1931). ibid. B13, 134; (1931) B14, 149; (1932) B17, 161 — the polarization theory. Read only through BET’s restatement (eqs. 1–4a and footnote 3).
Bradley, R. S. (1936). J. Chem. Soc., 1467 and 1799 — the polarization isotherm applied to argon on copper and aluminium sulfate, and the source of the \(k\) values 0.6075 and 0.615 this page tests. Read only through BET’s restatement.
Emmett, P. H. and Brunauer, S. (1937). This Journal 59, 1553 — the table of molecular cross-sectional areas behind the surface columns of Tables III and V. Not on disk. The cross-sections used on this page are recovered by inverting those two columns, and the recovery is checked across the two tables independently.
McGavack, J. and Patrick, W. A. (1920). This Journal 42, 946 — the SO₂ isotherms behind Table IV. Palmer, W. G. and Clark, R. E. D. (1935). Proc. Roy. Soc. (London) A149, 360 — the HF-dissolution surface areas. Goldman, F. and Polanyi, M. (1928). Z. physik. Chem. 132, 321 — the ethyl-chloride isotherms of Fig. 6, which this page scopes out. McBain, J. W. (1932). The Sorption of Gases by Solids, Routledge, p. 169 — “persorption”. International Critical Tables Vol. I p. 103 and Vol. VII p. 11 — the density of solid argon and the refractive index of argon gas. None consulted. Where this page needs one of these quantities it says so and recovers it by inversion.
Langmuir, I. — the unimolecular derivation the BET treatment generalises. Cited by name throughout the 1938 paper without a reference of its own; not consulted, and no Langmuir equation on this page comes from anywhere but eq. (B) at \(n = 1\).